Environmental risk assessment (ERA) methods are structured processes that scientists use to estimate the likelihood and severity of harm that pollutants pose to living organisms. These methods not only integrate hazard identification, exposure, dose, and toxicity data, but also explicitly state uncertainty, enabling communities to protect ecosystems.
Table of contents
- What Is Environmental Risk Assessment?
- Why Do Environmental Risk Assessment Methods Matter?
- The Four Core Steps of an Environmental Risk Assessment
- What Methods and Tools Do Scientists Use?
- Why Ecosystem-Level Effects Complicate Risk Assessment
- Frequently Asked Questions About ERA Methods
- Key Takeaways and Where to Learn More
- How This Guide Was Compiled
- References
What Is Environmental Risk Assessment?
Every glass of tap water undergoes a quiet safety check before it reaches a kitchen sink. That check relies on environmental risk assessment methods. These structured processes estimate the likelihood of a stressor causing harm and the severity of that harm. That check also protects wildlife, long before anyone notices a problem.
ERA methods examine stressors such as chemicals, sediment, and invasive species. They integrate hazard identification, exposure, dose, and toxicity data. In addition to estimating risk, they explicitly state uncertainty, because no prediction is perfect. As a result, decision-makers receive defensible evidence.
Many students confuse ERA with environmental toxicology. Environmental toxicology and ecotoxicology provide the foundational hazard and effects data—the pillar article linked below covers these definitions in detail. ERA is the decision-making process that applies this science to a practical question: how much risk does a stressor pose here and now? To answer this question, agencies use frameworks such as the US EPA Guidelines for Ecological Risk Assessment.
For the full definition of environmental toxicology, see the pillar article What Is Environmental Toxicology and Why Does It Matter?
Why Do Environmental Risk Assessment Methods Matter?
Structured ERA methods protect drinking water, food systems, wildlife, and human health. They also convert scattered measurements into data that regulators can use to set cleanup levels, issue permits, and impose bans. To make sound decisions, the agencies need evidence, not just guesswork.
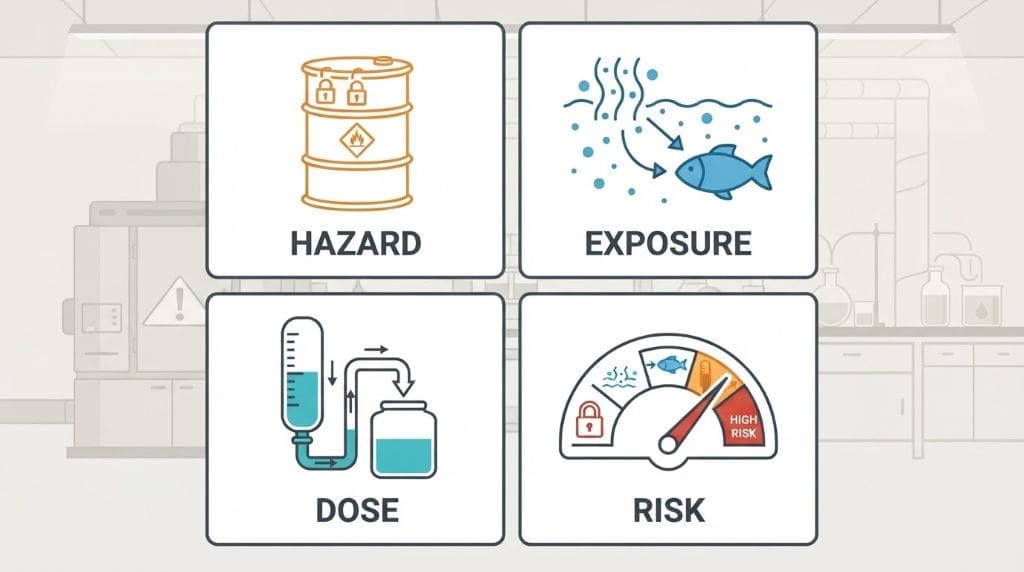

Four ideas remain distinct across all assessments. A hazard is the potential to cause harm, while exposure is the amount of a stressor that organisms actually encounter. DoseThe amount of a substance that actually enters an organism. More is the amount that enters an organism’s body, while risk combines the probability and severity of harm. A chemical must not only be toxic but also reach a living organism. Together, toxicity and exposure create risk.
For a closer look at how hazard differs from risk, see the pillar article’s hazard-versus-risk discussion.
Prior to any cleanup decision, agencies need to know which ecosystem services a stressor threatens. Clean water, food production, and wildlife habitat all depend on healthy ecosystems. Because risk connects chemicals to living systems, assessment methods increasingly link impacts to those services. De Luca Peña and colleagues reviewed 110 studies that integrate life cycle assessment, environmental risk assessment, and ecosystem services assessment. They also found that no approach fully integrates all three methods. As a result, aggregating results can double-count impacts. The review still supports the central point. RiskThe chance that harm occurs, given the hazard and the exposure. More methods work best when they weigh burdens on ecosystems alongside the benefits those ecosystems provide. As an illustration, the next section walks through those four core steps.
The Four Core Steps of an Environmental Risk Assessment
The US EPA published its 1998 Guidelines for Ecological Risk Assessment. These guidelines, therefore, structure the process into three phases: problem formulation, analysis, and risk characterisation. Furthermore, the analysis phase comprises four core steps common to nearly all modern methods.

Step 1: Hazard Identification
Scientists identify substances or stressors that could cause harm. They review toxicity studies, field observations, and chemical data to prioritise pesticides that harm test organisms at low doses for further study.
Step 2: Exposure Assessment
Scientists estimate how much of the stressor organisms actually encounter. They measure concentrations in water, soil, and air and track how long the exposure lasts. Duration matters because short and long exposures produce different outcomes.
Step 3: Effects (Dose–Response) Assessment
Scientists link exposure levels to biological effects. Dose–response relationships show how harm increases with dose. Meanwhile, laboratory tests often report the EC50, the concentration that affects 50 percent of test organisms.
Step 4: Risk Characterisation
Scientists combine exposure and effects data to estimate overall risk. They openly disclose uncertainties, including data gaps and assumptions. The output informs cleanup levels, permits, and monitoring plans.
This pattern is not unique to the EPA. Ngwenya and colleagues reviewed ten risk management frameworks, including TSCA and REACH. Each framework builds on hazard identification, exposure assessment, dose–response assessment, and risk characterisation. Many also incorporate weight-of-evidence and uncertainty analysis. In short, the same logical skeleton appears across countries. In addition to this shared pattern, the next section outlines the tools that support this work.
What Methods and Tools Do Scientists Use?
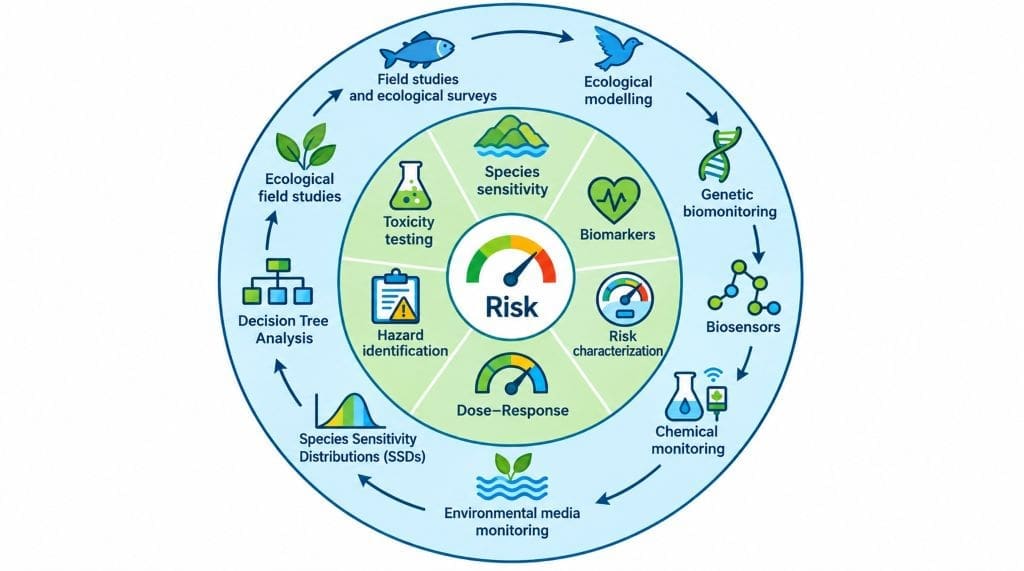
Laboratory toxicity testing exposes organisms to known concentrations. It answers a narrow question: how toxic is this chemical? Species sensitivity distributions aggregate sensitivities across many species into a single curve. The curve indicates which concentration protects most species. Biomarkers, such as enzyme changes, show whether exposure actually reached living tissue. In contrast, chemical monitoring measures the concentrations required for exposure assessment. Each tool addresses a different question, so scientists rarely rely on just one. Bayesian Belief Networks are probabilistic models that represent cause-and-effect relationships among variables such as exposure levels, stressors, and biological outcomes through a network of connected nodes. Scientists therefore use them to integrate different types of evidence, such as lab data, field observations, and expert judgment, and estimate the likelihood of environmental or ecological harm. Moreover, they can update these estimates as new data becomes available.
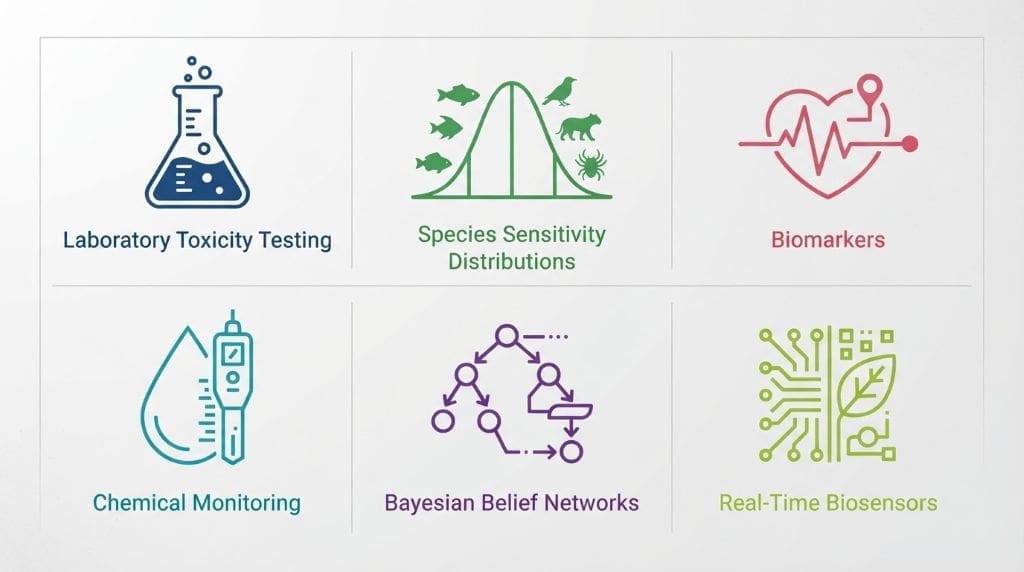
ERA methods address different questions. Some measure toxicity directly, while others model probabilities. Beyond choosing tools, scientists match each tool to a step in the four-step process.
Weight-of-evidence
This approach integrates multiple lines of evidence and weighs each one before concluding. They address a confidence question: how sure are we? By contrast, probabilistic models such as Bayesian belief networks estimate risk levels directly. Malekmohammadi and colleagues built one for the Shadegan International Wetlands, a Ramsar site in southwest Iran. The model combined seven risk factors, from drought to land-use change, and estimated the probability of high risk at about 73 percent. Prolonged drought emerged as the primary contributor. Such models answer two questions: how large the risk is and what drives it.
Multi-dimensional risk-factor
This method adds persistence to the classic risk quotient. The quotient divides the measured concentration by a predicted no-effect concentration. Li and colleagues proposed a synthetic risk factor that incorporates a persistence coefficient and compartment characteristics. The method flagged higher risk outcomes for persistent substances such as PFOS, imazalil, and bisphenol A. These results aligned with existing risk management practices. In short, the tool answers one practical question: does the classic estimate miss risks from long-lived chemicals?
Ecosystem-service-based risk assessment
This method is in a newer category. Qian and colleagues mapped 815 studies published between 1994 and 2023. They found the field moving from traditional to regional to landscape approaches, often using land use and land cover data. These methods identify which services and landscapes face the greatest risk. At the same time, scientists use multiple lines of evidence, models, and ecosystem-level tools. For example, the IUCN Red List of Ecosystems approach assesses collapse risk using combined evidence.
Real-time biosensors
These biosensors are emerging monitoring methods. Lu, Zhang, and Song summarise microbial fuel cell biosensors. In these devices, electroactive microorganisms generate electrical signals. The signals drop quickly when toxicants inhibit them. The rate of voltage inhibition serves as the toxicity indicator. This early warning feeds directly into risk assessment. No single tool wins every time. Because of these trade-offs, strong assessments combine methods.
Why Ecosystem-Level Effects Complicate Risk Assessment
Contaminants rarely act alone in real ecosystems. They move through food webs and species interactions. A chemical that spares fish in a lab tank can still starve them in the wild. When prey is lost, the whole food web weakens. Unlike single-species lab data, whole-ecosystem risk includes indirect effects, timing, and seasonal cycles. That translation gap is exactly why ecosystem-level methods keep growing, as Qian and colleagues document in a scientometric review. For a real-world example of an indirect effect cascading through a food web, the pillar article’s vulture and diclofenac example is worth a read.
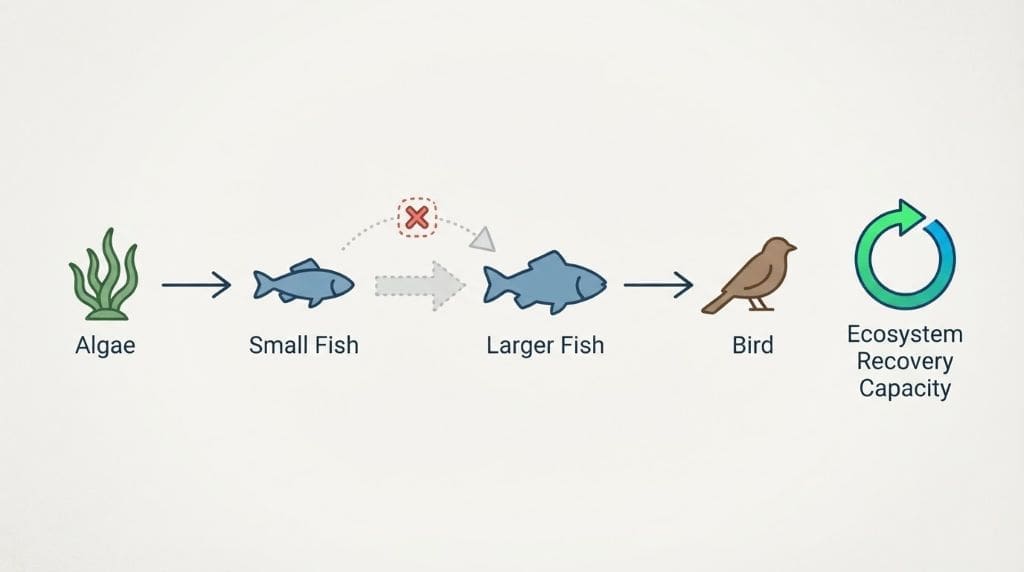
At the same time, ecosystems can absorb some stress. Species redundancy and recovery processes buffer small losses. Because resilience is hard to measure, risk methods must assess direct toxicity and recovery capacity together. Recovery takes time, and timing affects how risk builds. Lab data alone cannot show that balance. Beyond this gap, other challenges remain, as the next section explains.
Current Challenges in Environmental Risk Assessment
ERA methods still face significant challenges that appear directly in the numbers regulators receive. Real environments contain chemical mixtures, yet most lab tests handle one chemical at a time, so risk characterisation for combined exposures still relies on conservative assumptions rather than direct measurement. The species data gaps and lab-to-ecosystem translation problems that feed into this are covered in the pillar article; here, the practical effect is that assessors often carry that uncertainty forward as a safety factor rather than a resolved number. Beyond these gaps, climate change shifts exposure by altering rainfall, temperature, and chemical degradation. Warming water can speed chemical reactions and further stress organisms.
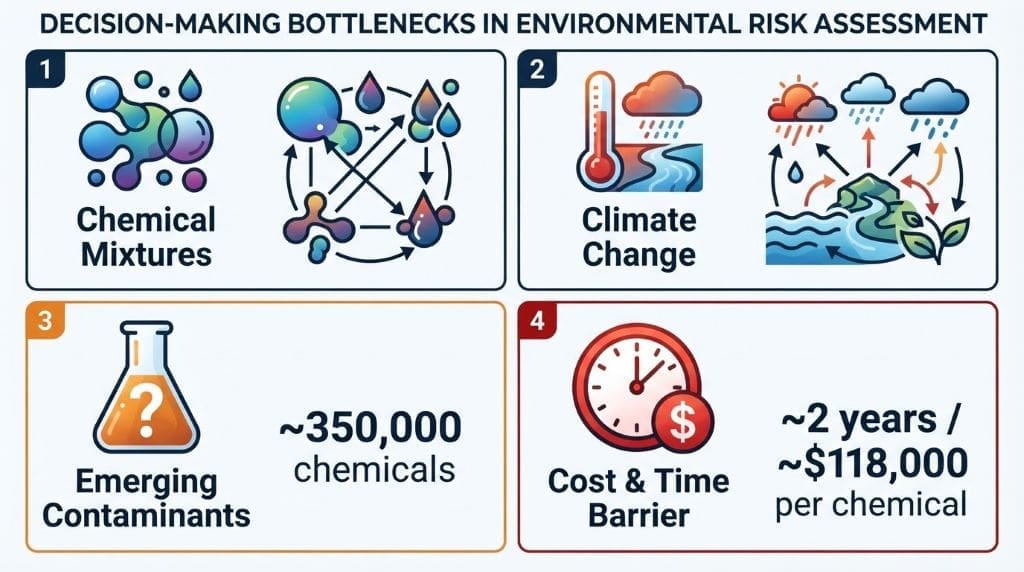
Emerging and unregulated contaminants add urgency. Zhao and colleagues report that about 350,000 widely used chemical substances may enter the environment. Governments regulate only about 500 to 1,000 of them, less than 1 percent, which is the “tip of the iceberg.” Traditional ecotoxicity testing for a single chemical costs about USD 118,000 on average, and generating that data takes about two years per substance. Because of these constraints, testing everything is impossible. The authors call for proactive identification and risk assessment of new contaminants. Evidence on many mixtures remains limited, so honest assessments say “we do not know” more often than scientists would like. For example, the classroom scenario below shows how students can work through these steps.
A Classroom Example — Assessing Risk in a Local Pond (Hypothetical Scenario)
The scenario below is hypothetical and designed for classroom practice. It does not describe a real event.
After a heavy rain, stormwater runoff enters a small pond. The runoff carries lawn fertiliser and oil residue from a school parking lot. A class walks through the four ERA steps from the EPA Guidelines.
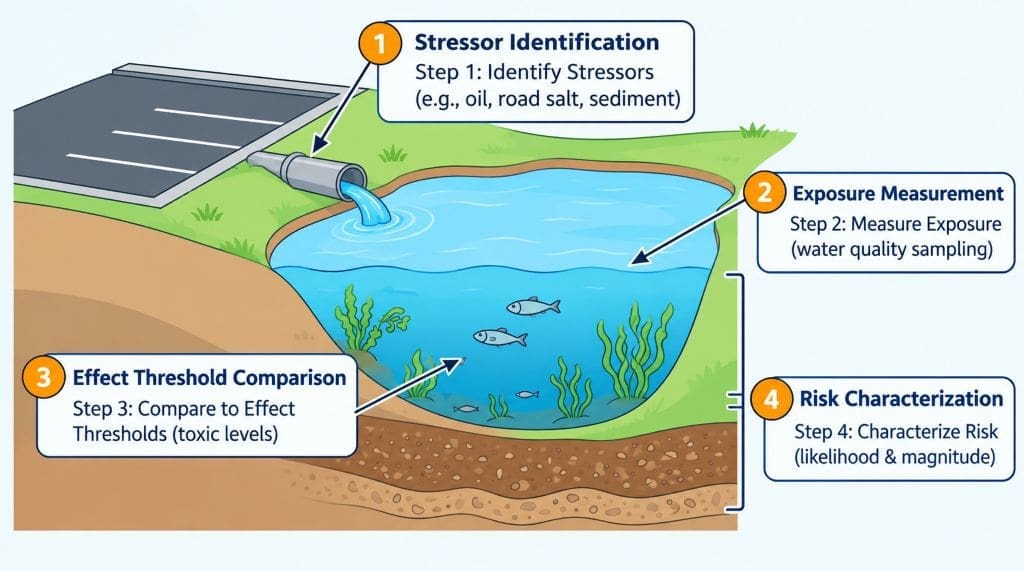
Step 1: Hazard Identification
Students list the stressors: nitrate from fertilisers, petroleum compounds, and soil sediment. They consult toxicity databases and confirm that each can harm aquatic life.
Step 2: Exposure Assessment
Students measure nitrate concentrations in the pond over three weeks. They map where runoff enters, where it concentrates, and how long it persists there.
Step 3: Effects (Dose–Response) Assessment
Students compare their measured levels with published effect thresholds for algae, insects, and fish. They find concentrations near the threshold for algal blooms.
Step 4: Risk Characterisation
Students estimate low risk for fish and moderate risk for algae and insect larvae. They express uncertainty, because, three weeks of data cannot capture seasonal peaks. To illustrate, they document all assumptions in a lab notebook.
Above all, the class learns that risk is a statement of probability, not certainty. To reduce risk, they propose installing a rain garden near the parking lot and extending the monitoring plan.
Frequently Asked Questions About ERA Methods
ERA methods keep the two apart by design: hazard identification and exposure assessment are treated as separate steps. Only risk characterisation combines them into a single estimate. That separation is why a stressor can score high on hazard yet be low risk once measured exposure is factored in, or vice versa.
HazardThe built-in ability of a substance to cause harm. More identification, exposure assessment, effects (dose–response) assessment, and risk characterisation. First, scientists identify stressors that could cause harm. Next, they estimate actual exposure. Then, they link doses to effects. Finally, they combine everything into a risk estimate, with uncertainty stated openly. Regulators use this output to set limits.
Weight of evidence means combining several independent lines of evidence and assessing the strength of each. Scientists weigh lab tests, field monitoring, and model results together. Because each line has weaknesses, this method avoids relying on a single flawed measurement. It builds confidence step by step.
Scientists test a mix of species across different feeding levels, such as algae, invertebrates, and fish. They choose species that are sensitive, ecologically important, and practical to raise in labs. Species sensitivity distributions then extend these results to untested species, with uncertainty openly stated.
Real ecosystems contain food webs, species interactions, and changing seasons. A chemical can harm organisms indirectly, for example by removing their prey or shelter. Because of these indirect effects, lab results for single species need careful adjustment. Scientists adjust them before applying the results to a whole ecosystem.
No. Scientists can reduce risk to very low levels. Zero is unreachable because ecosystems contain natural stressors and uncertainty persists. The realistic goal is an acceptable, well-characterised risk. Levels must remain low enough to protect ecosystem services and human health. Monitoring then catches surprises early.
A risk quotient divides the measured concentration by a predicted no-effect concentration. A synthetic risk factor extends this idea by incorporating persistence and compartmental features. As a result, long-lived pollutants such as PFOS can receive higher, more realistic risk ratings.
Bayesian belief networks are probabilistic models that link risk factors to outcomes. They integrate data and expert judgment and update as new information arrives. Scientists used one to analyse the Shadegan wetlands and identified drought as the primary driver of high risk.
Emerging contaminants are difficult to regulate because toxicity data arrives slowly and at high cost. About 350,000 widely used chemicals may enter the environment, while governments regulate only 500 to 1,000. Proactive screening, rather than reactive listing, could close this governance gap.
Key Takeaways and Where to Learn More
- Environmental risk assessment estimates the likelihood and severity of harm to organisms, populations, and ecosystems.
- The four core steps are hazard identification, exposure assessment, effects (dose–response) assessment, and risk characterisation.
- Tools range from laboratory tests and biomarkers to Bayesian belief networks and real-time biosensors.
- Scientists openly acknowledge uncertainty; the goal is well-characterised risk, not zero risk.
- Emerging contaminants require proactive, ecosystem-level assessment.
How This Guide Was Compiled
This guide combines established environmental risk assessment evidence with findings from eight open-access, peer-reviewed studies. The U.S. Environmental Protection Agency’s Guidelines for Ecological Risk Assessment provide the core framework for problem formulation, analysis, and risk characterisation, including the four practical steps used throughout this guide: hazard identification, exposure assessment, effects (dose–response) assessment, and risk characterisation. Government resources, including the US EPA, provide guidelines for Ecological Risk Assessment. Editorial choices follow EEAT principles: transparent sourcing, named publications, firsthand verification, and a clear statement of the guide’s audience. No search-engine metrics are claimed. Internal links point to live nycstem.in pages that were verified at the time of writing.
References
De Luca Peña, L. V., Taelman, S. E., Préat, N., Boone, L., Van der Biest, K., Custódio, M., Hernandez Lucas, S., Everaert, G., & Dewulf, J. (2022). Towards a comprehensive sustainability methodology to assess anthropogenic impacts on ecosystems: Review of the integration of Life Cycle Assessment, Environmental Risk Assessment and Ecosystem Services Assessment. Science of the Total Environment, 808, 152125. https://doi.org/10.1016/j.scitotenv.2021.152125
Li, L., Dong, Y., Chen, Y., Jiao, J., & Zou, X. (2022). A new method for environmental risk assessment of pollutants based on multi-dimensional risk factors. Toxics, 10(11), 659. https://doi.org/10.3390/toxics10110659
Lu, H., Zhang, Z., & Song, F. (2025). Occurrence, accumulation, and impacts of environmental pollutants in aquatic systems. Toxics, 13(11), 994. https://doi.org/10.3390/toxics13110994
Malekmohammadi, B., Uvo, C. B., Tayebzadeh Moghadam, N., Noori, R., & Abolfathi, S. (2023). Environmental risk assessment of wetland ecosystems using Bayesian belief networks. Hydrology, 10(1), 16. https://doi.org/10.3390/hydrology10010016
Ngwenya, S., Mashau, N. S., Mhlongo, S. E., & Traoré, A. N. (2023). A systematic review of the risk management frameworks for potentially toxic chemical elements. Toxicology and Industrial Health, 39(12), 679–686. https://doi.org/10.1177/07482337231209092
Qian, L., Zeng, X., Ding, Y., & Peng, L. (2023). Mapping the knowledge of ecosystem service-based ecological risk assessment: Scientometric analysis in CiteSpace, VOSviewer, and SciMAT. Frontiers in Environmental Science, 11, 1326425. https://doi.org/10.3389/fenvs.2023.1326425
U.S. Environmental Protection Agency. (1998). Guidelines for ecological risk assessment (EPA/630/R-95/002F). Risk Assessment Forum. https://www.epa.gov/risk/guidelines-ecological-risk-assessment
Zhao, X., Wang, X., He, J., Feng, C., Jin, X., Leung, K. M. Y., Xu, J., Li, C., Wang, J., Liu, S., Dou, Y., Xi, B., & Wu, F. (2025). Time to strengthen the governance of new contaminants in the environment. Nature Communications, 16, 7775. https://doi.org/10.1038/s41467-025-63217-4
List of terms
- Dose
- Risk
- Hazard