Estimated reading time: 18 minutes
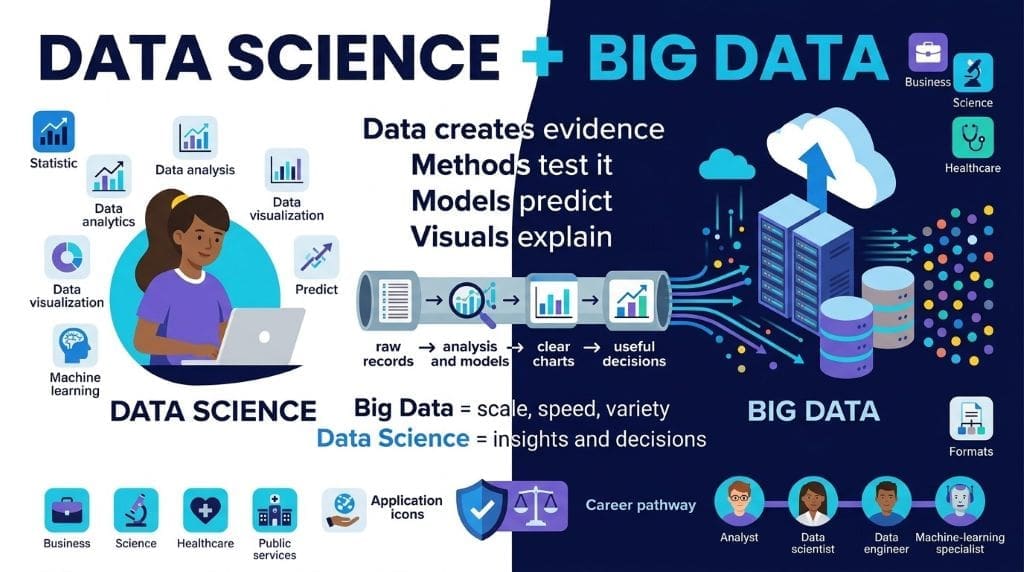
Data Science is the field of extracting insights from data, while Big Data refers to extremely large, fast, and complex datasets. Together, they shape decisions across business, science, healthcare, and public services. Data Science for Beginners involves turning raw records into useful findings. Big Data supplies the scale, speed, and variety behind many modern problems. At first, these terms may sound identical. They are not. Data Science combines Statistics, Data Analysis, Data Visualization, and Machine Learning. It also relies on Data Engineering for dependable data pipelines. Big Data Technologies support storage and processing at massive scales. For beginners, the key idea stays simple. Data creates evidence. Methods test that evidence. Models can predict likely outcomes. Visuals make findings easier to explain. This guide explains both fields without unnecessary jargon. It also shows practical skills, tools, ethics, learning steps, and career paths.
Key Takeaways
- Data Science finds patterns, answers questions, and supports decisions.
- Big Data describes data that exceeds traditional system limits.
- Statistics helps people judge whether findings are trustworthy.
- Data Engineering prepares data for analysis and machine learning.
- Visualizations help teams understand results quickly and clearly.
- Responsible work requires privacy, fairness, security, and documentation.
- Beginners can build skills through projects and structured practice.
At any rate, beginners should not treat tools as magic. Every useful analysis starts with a clear question and relevant data. In short, software helps people work faster, but sound reasoning builds trustworthy conclusions. After that, structured practice can turn concepts into projects and careers
Understanding Data Science and Big Data for Beginners
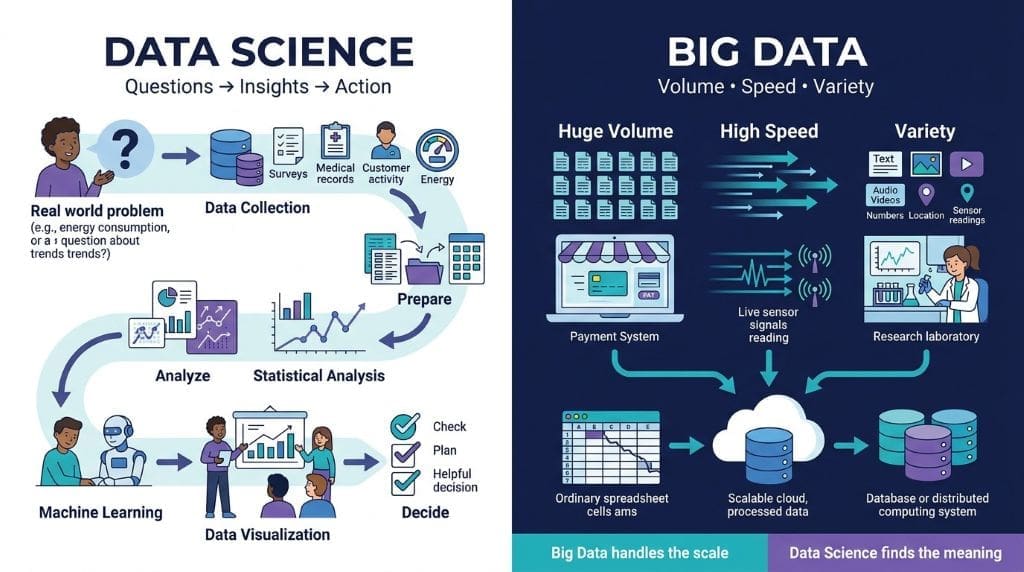
Data Science uses data to answer questions and guide action. It combines mathematics with computing and domain knowledge. A data scientist may study customer behavior, disease patterns, or energy demand. The process usually starts with a real-world question. Next, the practitioner collects and prepares relevant data. After that, they analyze patterns using statistical methods. Machine Learning may help predict future outcomes. Data Visualization then communicates the results to others. In contrast, Big Data focuses on difficult data conditions. These conditions include high volume, rapid generation, and varied formats. A company may receive millions of transactions daily. A research lab may process sensor readings continuously. In either case, traditional spreadsheets may no longer work well. Big Data systems help store and process this information. Data Science uses those systems when the problem requires them.Your Attractive Heading
Where Beginners Should Begin
Beginners should start with questions, not expensive tools. Ask what decision the data should improve. For example, a school may ask why attendance changes. A hospital may ask which appointments patients miss. A retailer may ask which products often sell together. These questions define the needed data. They also guide the analysis method. Problem framing comes before coding. Statistics comes before bold predictions. At the same time, beginners should learn basic data structures. Tables contain rows and columns. Databases store related tables efficiently. Text, images, logs, and videos require different handling. Big Data becomes relevant when scale creates technical limits. Those limits may involve storage, processing speed, or data complexity. As a matter of fact, many beginner projects use small datasets. That is completely acceptable. The analytical workflow matters more than dataset size.
Why are Data Science and Big Data important today?
Organizations now create data through phones, websites, machines, and services. This information can improve planning and public outcomes. For instance, transit agencies can study travel patterns. Scientists can examine climate observations over long periods. Banks can detect suspicious transactions faster. Yet data alone does not create value. Teams need skilled people and reliable processes. Evidence-based decisions require context, validation, and clear communication. To explain, a correlation does not always prove causation. Ice cream sales and heat-related illnesses may rise together. Temperature may influence both outcomes. A weak analysis can lead teams toward harmful choices. Therefore, Data Science must include careful reasoning. Big Data systems also need governance and security. The NIST Big Data definitions describe Big Data through technical and operational characteristics. These concepts help beginners separate scale problems from analytical problems.
Data Science vs. Big Data vs. Data Analytics
Data Science
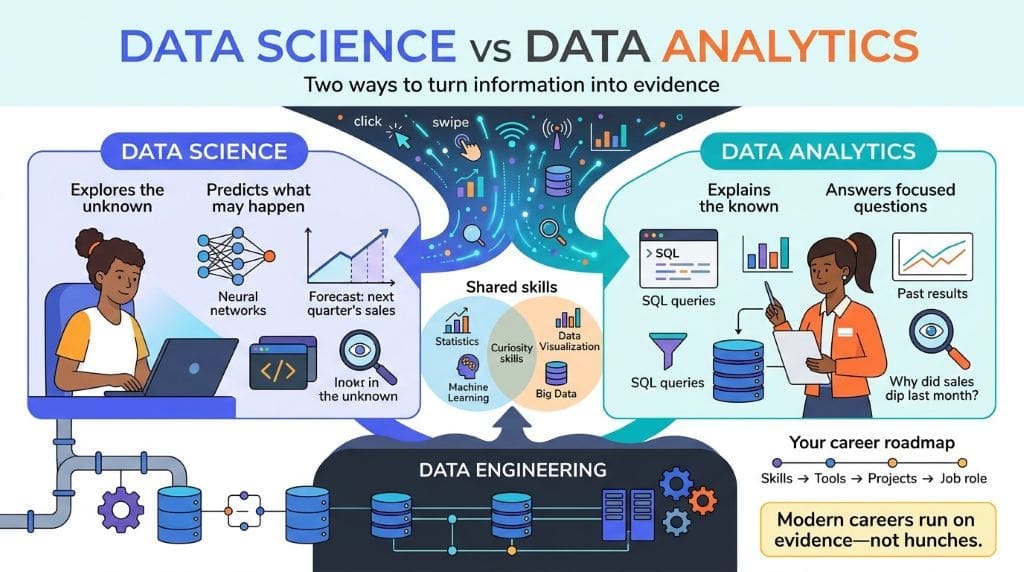
A multidisciplinary field that uses statistics, programming, analysis, and models. It seeks insights, explanations, and predictions from data.
Big Data
A term for datasets and workloads exceeding conventional processing capabilities. It often requires distributed storage and computing systems.
Data Analytics
A practice of examining data for trends and answers. It often emphasizes reporting, measurement, and business decisions.
These fields overlap, but they serve different purposes. Data Analytics often answers what happened. Data Science can also ask why it happened. It may also estimate what could happen next. Big Data supports work when normal tools cannot cope. However, not every Data Science project uses Big Data. A carefully designed survey may contain limited records. It can still produce valuable insights. Similarly, a Big Data platform may merely store data. It does not automatically create understanding. Context determines which approach fits the situation. The NIST reference architecture explains important roles across Big Data ecosystems. These roles include data providers, data consumers, framework providers, and system management. Beginners should learn this distinction early. It prevents tool-driven thinking and improves project choices.
How Data Science and Big Data Work Together
Data Science and Big Data often meet inside modern data systems. A streaming platform, for example, gathers viewing events constantly. These events may include timestamps, devices, searches, and completed programs. Big Data Technologies can store these records across many machines. Data Engineering then cleans and organizes the information. Data Science teams use the prepared data for analysis. They may build recommendation models or measure engagement patterns. Distributed computing becomes useful when one computer cannot process everything. Frameworks such as Apache Spark can process tasks across clusters. Databases such as Hadoop Distributed File System support large storage workloads. Still, tools should follow the problem. Small teams may use SQL and Python first. In fact, simple tools often produce faster learning. Complexity should solve a genuine limitation. It should never become a status symbol.
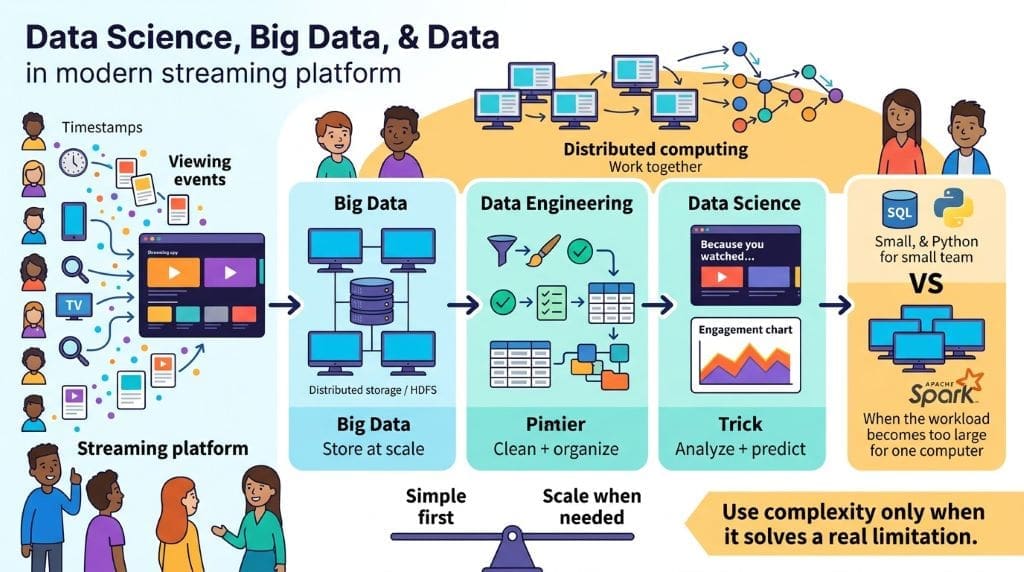
How Data Science and Big Data create useful workflows
A practical workflow contains connected stages. First, teams define a business, research, or civic question. Second, they identify suitable data sources. Third, engineers ingest data from files, applications, sensors, or APIs. Fourth, teams validate quality and remove obvious errors. Fifth, analysts explore distributions, trends, and relationships. Sixth, practitioners build models where prediction adds value. Finally, they monitor outcomes after deployment. Data quality affects every stage. Missing values can distort results. Duplicate records can exaggerate activity. Biased samples can produce misleading models. As has been noted in Big Data research, technical scale creates distinct management challenges. The open-access Journal of Big Data review discusses these challenges across storage, processing, and analysis. A workflow creates repeatability. Repeatability helps teams test, improve, and explain their work.
A data pipeline moves information from source to destination. One pipeline may collect website events every minute. Another may process a monthly government dataset. Batch processing handles data at scheduled intervals. Stream processing handles data as it arrives. Both approaches have valid uses. Batch systems often suit reporting and historical analysis. Stream systems can support fraud alerts or equipment monitoring. However, fast processing does not guarantee correct decisions. Teams must check whether incoming data makes sense. They should also track schema changes. A schema describes expected fields and formats. For example, a date field should not suddenly contain product names. To point out another concern, pipelines need access controls. Sensitive data should not reach every user. Documentation also matters. It explains sources, transformations, owners, and limitations.
The five Vs of Big Data
The five Vs offer a useful beginner framework. Volume means the amount of collected data. Velocity means the speed of data creation. Variety means different structures and formats. Veracity means data reliability and quality. Value means practical usefulness for a decision. Volume may involve billions of rows. Velocity may involve real-time payment events. Variety may include text, images, GPS signals, and tables. Veracity includes missing records, measurement errors, and inconsistent labels. Value asks whether the work helps someone act better. At first, people often focus only on volume. Yet poor-quality giant datasets can cause major problems. A smaller trusted dataset may serve a project better. Therefore, beginners should assess every V together. The framework supports clear communication with nontechnical teams. It also helps decide whether a Big Data solution is necessary.
Tools Beginners Need for Big Data Projects
Beginners need fewer tools than many courses suggest. Start with spreadsheets for simple exploration. Then learn SQL for querying structured databases. After that, use Python or R for analysis. Python libraries such as pandas support data cleaning. Matplotlib and seaborn support basic Data Visualization. SQL remains essential across many data roles. It helps filter, join, group, and summarize information. Later, learners can explore cloud platforms and distributed tools. Apache Spark is useful for large-scale processing. Kafka supports event streaming in many systems. Docker helps teams package applications consistently. Yet no tool replaces fundamentals. Learn data types, joins, summary statistics, and chart selection first. For structured learning options, review Entech Online’s technology training. Choose courses that include hands-on practice. Projects should explain decisions, not merely display software badges.
Essential Skills for Data Science and Big Data
Strong practitioners combine technical and human skills. Statistics helps them measure uncertainty and variation. Programming helps them automate repetitive tasks. Data analysis helps practitioners identify meaningful patterns, visualization makes those findings easier to explain, and data engineering creates the dependable flows that support the entire process.Communication connects all these abilities. A model has little value if nobody understands it. Likewise, a dashboard fails when it answers no real question. Beginners should also learn domain knowledge. Health data requires different context than retail data. Financial data involves rules that education data may not. In general, the best analysts ask precise questions. They also admit what data cannot prove. This habit builds trust. It also reduces the risk of overconfident claims.
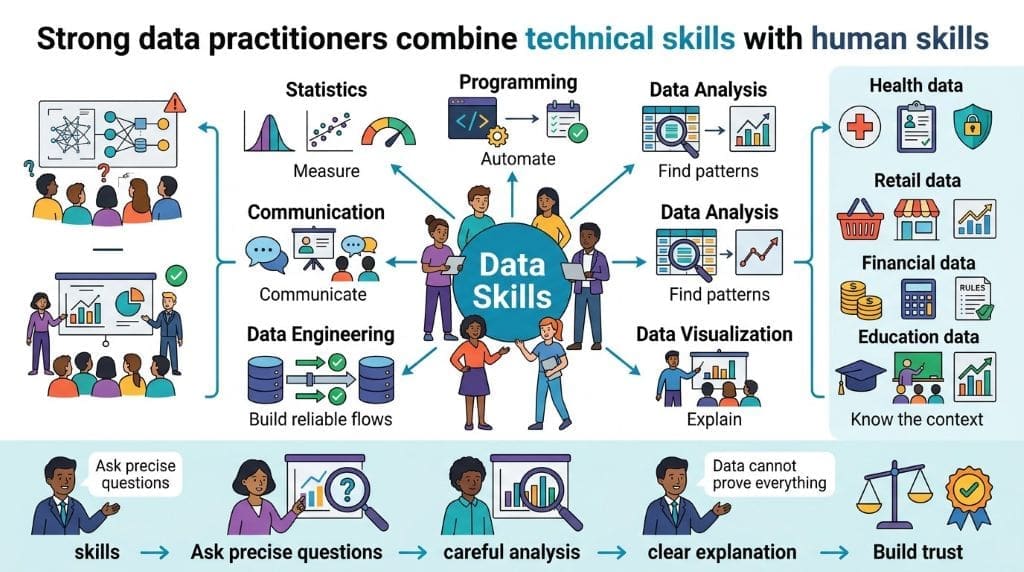
Data Science and Big Data skills: What should you learn first?
Start with basic numerical reasoning. Learn averages, percentages, distributions, and probability. Then study sampling and hypothesis testing. These skills make analysis more reliable. Next, learn spreadsheet formulas and SQL queries. After that, use Python for repeatable data tasks. Python supports cleaning, analysis, visualization, and machine learning. Beginners should understand code, not copy it blindly. Read error messages carefully. Test small pieces of code often. Keep notes about assumptions and changes. At the same time, learn chart design principles. A chart should match the question. Line charts show changes across time. Bar charts compare categories. Scatter plots show possible relationships. Avoid misleading axes and unnecessary decoration. Clear visuals help decision-makers focus on evidence. The American Statistical Association’s educational resources can support foundational statistics learning.
Statistics helps beginners avoid common analytical mistakes. Averages can hide important differences between groups. Percentages can mislead without showing the denominator. Small samples can create unstable conclusions. Uncertainty should appear in every serious analysis. Confidence intervals can show plausible ranges. Statistical tests can compare observed patterns carefully. However, these methods require assumptions. Data may not represent the population of interest. Measurements may contain systematic bias. Therefore, learners should inspect collection methods before modeling. A polished chart cannot repair weak data. Nor can complex Machine Learning fix unclear labels. This principle appears repeatedly in professional practice. Better inputs usually improve outcomes more than elaborate algorithms. To this end, beginners should document data sources. They should record known gaps and possible sources of bias.
Why ethics matters in Data Science ?
Data work affects real people and communities. A model may influence hiring, lending, healthcare, or policing decisions. Therefore, technical accuracy alone is not enough. Teams must consider privacy, fairness, and accountability. Bias can enter through historical records. It can also enter through missing data or labels. For example, past hiring decisions may reflect unequal opportunities. A model trained on those decisions can repeat that pattern. Data minimization offers one useful practice. Collect only information needed for a defined purpose. Access controls offer another important practice. People should see sensitive data only when required. As a matter of fact, transparency helps teams detect issues earlier. Explain how data was collected and used. Describe model limits in clear language. Independent review can also reduce harmful outcomes.
Personal classroom observation reinforces this lesson. During a data workshop, students built prediction exercises. Many focused immediately on model accuracy. Then one group inspected its dataset closely. They found repeated records from one source. Duplicate data had inflated their apparent performance. After that, the class compared results before and after cleaning. Accuracy dropped, but reliability improved. This moment made an important point clear. Evaluation metrics cannot replace careful data preparation. Students also learned to ask who was missing. The dataset contained fewer records from certain neighborhoods. That gap could affect fairness and usefulness. In short, ethical practice begins before model training. It starts when teams decide what data to collect. It continues through analysis, deployment, monitoring, and revision.
A Step-by-Step Learning Path for Beginners
Learning Data Science and Big Data works best through an ordered plan. Start with concepts that explain why methods work. Then practice using small, understandable datasets. After that, build projects that solve focused problems. Consistency matters more than rushing through tools. Set aside regular study sessions each week. Write notes in your own words. Recreate examples without looking at answers. Share projects with peers or mentors. Feedback reveals gaps that tutorials may hide. At the same time, avoid comparing your progress unfairly. People enter this field with different backgrounds. Some know programming already. Others understand business or research deeply. Both experiences can become strengths. The seven steps below progress from core concepts toward career readiness.
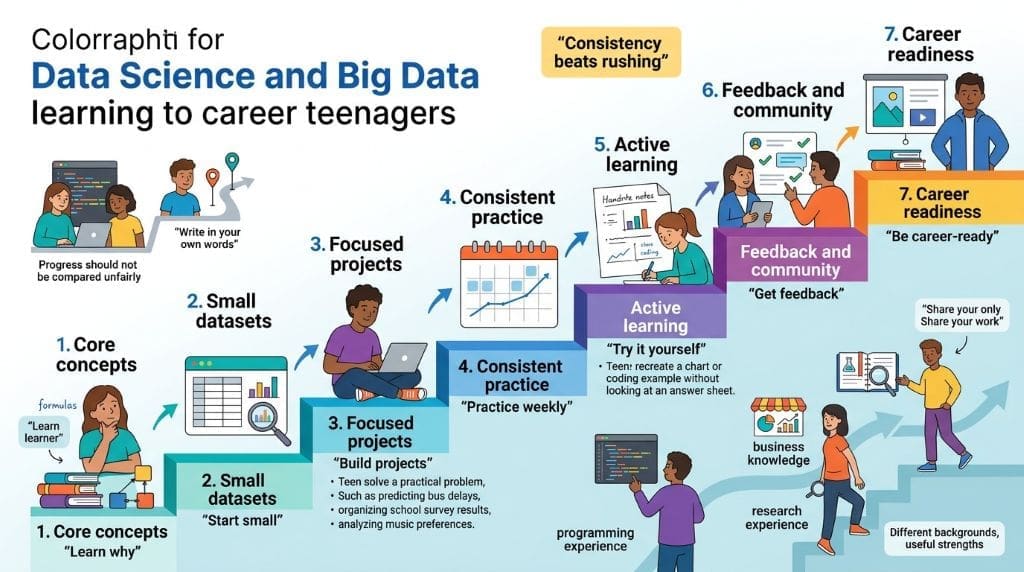
A seven-step beginner path for Data Science and Big Data
- Learn data basics and spreadsheet thinking.
Understand rows, columns, formats, and simple formulas. Practice sorting, filtering, and checking missing values. Learn how data collection choices affect results. - Build Statistics foundations.
Study averages, variation, probability, sampling, and correlation. Use simple examples before studying formal equations. Focus on interpreting results accurately. - Master SQL for structured data.
Practice SELECT, WHERE, GROUP BY, JOIN, and ORDER BY. Query public datasets with clear questions. SQL supports analytics, engineering, and science roles. - Use Python for Data Analysis.
Learn variables, loops, functions, and files. Then use pandas for cleaning and transforming tables. Create reproducible notebooks with explanations. - Create useful Data Visualizations.
Match chart types with analytical goals. Label axes clearly and provide necessary context. Explain trends without exaggerating weak evidence. - Explore Machine Learning and Big Data Technologies.
Learn supervised and unsupervised learning basics. Then study distributed storage and processing concepts. Use Spark only after understanding smaller workflows. - Build a portfolio and prepare professionally.
Publish well-documented projects with clear problem statements. Show methods, findings, limitations, and ethical considerations. Practice explaining work to nontechnical audiences.
These steps create a practical learning sequence. At first, data fundamentals build confidence. Statistics then provides a framework for judging findings. SQL and Python add working capabilities. Visualization improves communication with stakeholders. Machine Learning introduces prediction and classification. Big Data Technologies add scale-related knowledge later. Portfolio projects connect all these skills. A good beginner project may analyze city services. Another may study public health trends. A third may examine school attendance patterns. Use openly licensed data whenever possible. Explain every decision in a short project report. In fact, hiring teams often value clear reasoning. They also value clean code and honest limitations. A small complete project can outperform a large unfinished one.
Data Science and Big Data projects for beginners
Choose projects that answer specific questions. Avoid projects built only to use a tool. For example, analyze local air-quality measurements over time. Explore whether certain months show higher pollution. Create a dashboard showing trends and data gaps. Another project could examine public transit arrival records. Measure delays by route, hour, or weather condition. Public datasets provide safer starting points for beginners. Government portals often publish transport, environment, and demographic records. Universities also share research datasets with documentation. Before using any dataset, read its metadata carefully. Metadata explains collection methods and variable definitions. It may also identify limitations. To illustrate, a crime dataset may show reported incidents only. It cannot measure every incident that occurred. Clear caveats strengthen a portfolio project. They show responsible analytical judgment.
Beginner projects should include five visible sections. First, define the question and audience. Second, describe the data source and its limits. Third, explain cleaning and transformation steps. Fourth, present analysis and visualizations. Fifth, state findings and recommendations cautiously. Reproducibility makes projects more credible. Store code in a version-controlled repository. Include a README file with setup instructions. List packages and data sources. Remove private information before publishing anything. Then ask another person to follow your steps. If they cannot reproduce results, improve the documentation. This practice mirrors professional teamwork. It also prepares learners for interviews. For additional training pathways, explore Entech Online’s professional learning options. Select programs that teach concepts alongside projects. Certificates can help, provided that practical work supports them.
Careers using Data Science and Big Data skills
Data careers include several distinct roles. Analysts focus on reporting, trends, and business questions, while data scientists develop analyses, experiments, and predictive models. Engineers build pipelines, platforms, and reliable data infrastructure. Machine learning engineers help deploy and maintain models. Business intelligence specialists create reporting systems and dashboards. Research analysts support studies using quantitative methods, while product analysts study how people use digital products.
Career titles vary across employers, so read job descriptions carefully. Look for required skills, responsibilities, and tools. For example, an analyst role may require SQL and Tableau. Engineering positions may expect knowledge of cloud platforms and Spark. By contrast, data science roles often emphasize statistics and experimentation. Start with roles that match your strongest current skills, then develop deeper specialization through real projects. Review the daily work involved, because the best fit depends on both interests and long-term goals.
What responsible practices should every data beginner follow?
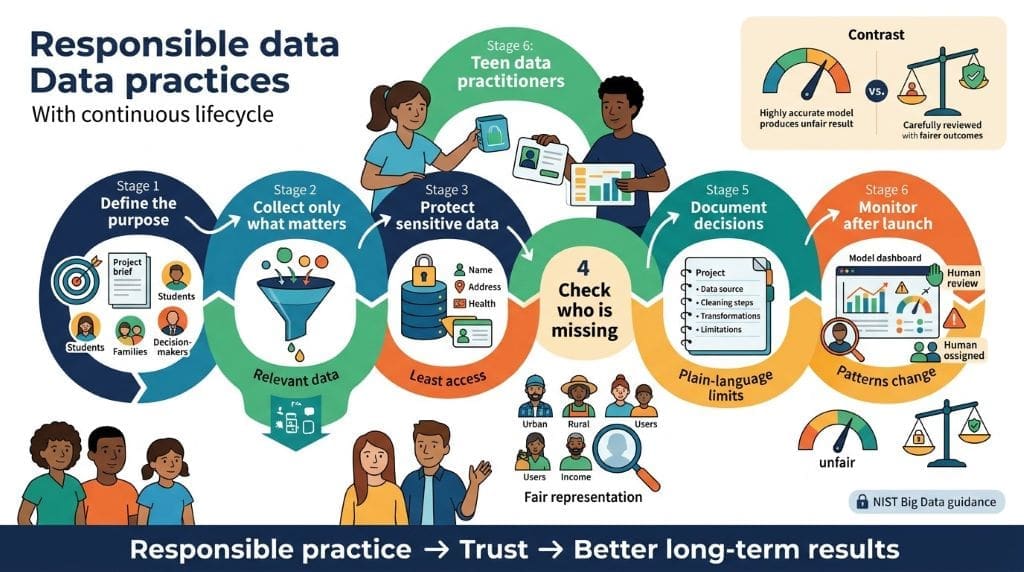
Responsible data work starts before any analysis begins. Beginners should first identify the project’s purpose and intended audience. Next, they should collect only relevant information. This practice reduces privacy and security risks. Sensitive data requires strict access controls. Names, addresses, and health details need special protection. At the same time, teams should check for missing groups. A dataset may exclude rural communities or low-income users. Such gaps can create unfair results. Documentation also supports responsible project work. Record where the data came from. Explain every cleaning or transformation decision. State important limitations in plain language.
In addition, check whether results could harm people. A highly accurate model may still produce unfair outcomes. Teams should monitor models after deployment. Data patterns can change over time. Therefore, earlier results may no longer remain reliable. NIST Big Data guidance supports clear roles and governance across data systems. Review the NIST Big Data Interoperability Framework for a structured technical reference. All things considered, responsible practice builds trust and improves long-term results.
Frequently Asked Questions About Data Science and Big Data
It can be challenging, but learning step by step with small projects makes it manageable.
No. Practical skills in Python, SQL, statistics, and projects can be enough.
Start with Python for broader industry use; learn R later if needed for research or statistics.
No. Big Data is about large/complex data, while cloud computing provides computing resources.
Yes. Most analyst roles focus on SQL, dashboards, spreadsheets, and data insights.
Basic skills can take a few months; professional readiness often takes consistent practice over a year or more.
How This Guide Was Compiled
This guide uses a beginner-first teaching structure. It moves from definitions toward skills and careers. The approach also reflects reputable technical and academic sources. NIST publications informed the Big Data definitions and architecture discussion. Peer-reviewed research informed the discussion of Big Data challenges. The Stanford HAI AI Index Report serves as the statistical foundation for broader technology context. However, this guide does not invent report statistics. It uses the report as a reference point. SourceFrom where the toxicant is released, such as a factory, farm, or vehicle. More quality guided every included reference. Priority went to government publications, university resources, and peer-reviewed research. The article also separates technical concepts from career advice. This distinction helps beginners make realistic decisions. At the same time, the classroom observation illustrates a recurring teaching lesson. Data preparation, ethical awareness, and explanation matter as much as model selection.
Verified Resources
The following sources are academic, government, and research resources supporting Big Data, analytics, data systems, and AI trends.
Boyd, D., & Crawford, K. (2014). Critical questions for big data. Information, Communication & Society, 15(5), 662–679. https://doi.org/10.1177/2053951714528481
Chen, H., Chiang, R. H. L., & Storey, V. C. (2017). Business intelligence and analytics: From big data to big impact. ACM Transactions on Management Information Systems, 8(4), Article 15. https://doi.org/10.1145/3076253
Khan, N., Yaqoob, I., Hashem, I. A. T., Inayat, Z., Ali, W. K. M., Alam, M., Shiraz, M., & Gani, A. (2016). Big data: Survey, technologies, opportunities, and challenges. Journal of Big Data, 3, Article 18. https://doi.org/10.1186/s40537-016-0059-y
National Institute of Standards and Technology. (2015). NIST big data interoperability framework: Volume 1, definitions (NIST Special Publication 1500-1). https://www.nist.gov/publications/nist-big-data-interoperability-framework-volume-1-definitions
National Institute of Standards and Technology. (2018). NIST big data interoperability framework: Volume 6, reference architecture (NIST Special Publication 1500-6r2). https://www.nist.gov/publications/nist-big-data-interoperability-framework-volume-6-reference-architecture
List of terms
- Source