
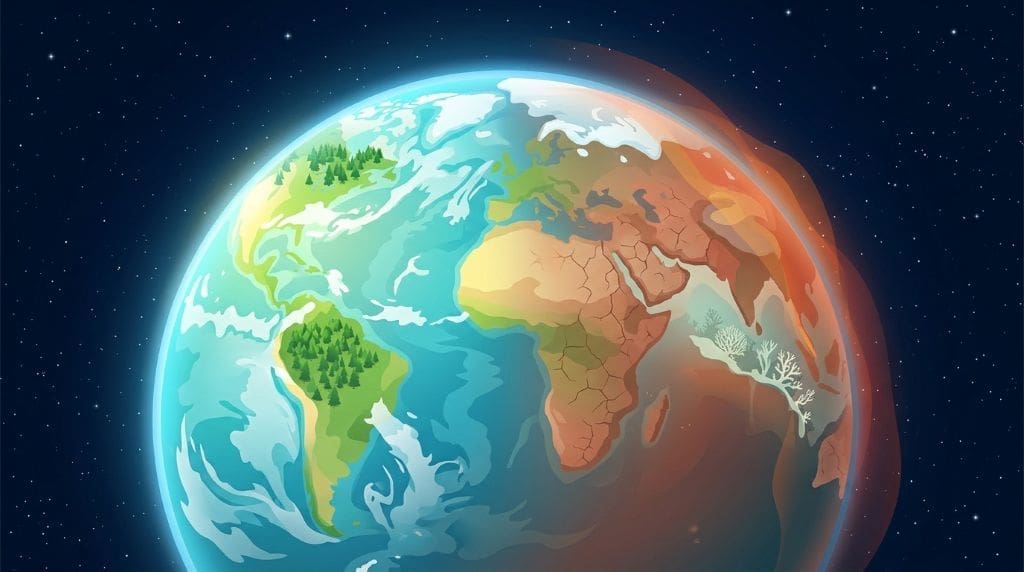
Average temperatures and weather patterns have changed over long periods because of gases humans emit into the atmosphere. These changes affect the natural environment, food supplies, weather conditions, and communities. To study climate change, scientists look at it over many years rather than just one season.
This simple definition is only the beginning; the problem is bigger than it first appears. Burning coal, oil, and gas releases greenhouse gases, which absorb heat. This extra heat changes the weather, affects plants and animals, and causes sea levels to rise. Floods and storms now happen more frequently and with greater intensity, thus affecting people’s lives. Because of these issues, schools, city governments, and international conferences address climate change. This guide provides science-based information, grounded in clear facts, and links to observe and take action.
Key Takeaways: Climate Change for Students
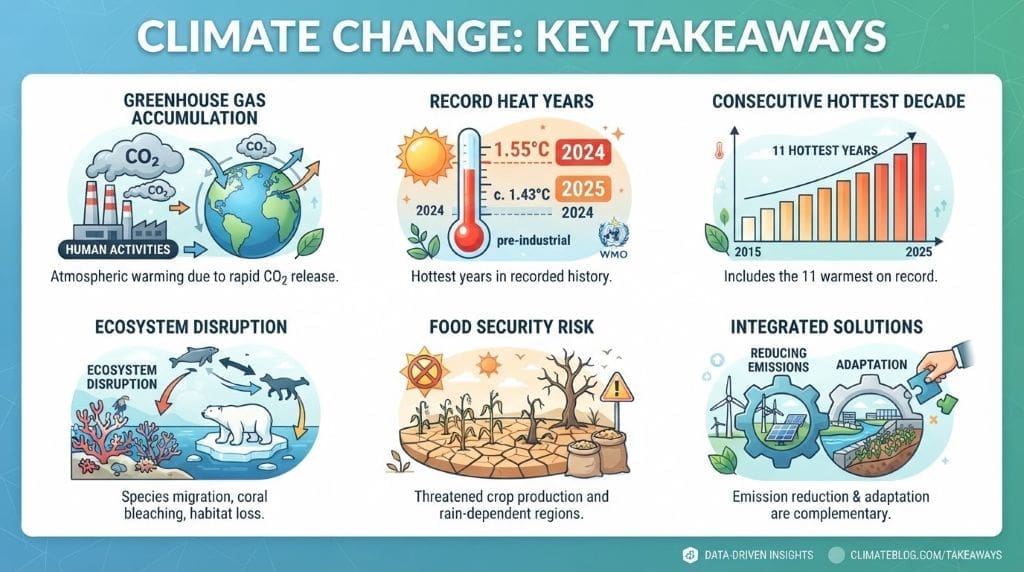
The past decade has been unprecedented: Earth’s warmest years on record cluster between 2015 and 2025, triggering visible shifts in nature and threatening vulnerable communities. Here’s what the data reveals about climate impacts and the dual strategy needed to address them.
What Is Climate Change? A Simple Explanation for Students
Start with the basics: climate refers to the type of weather a particular area generally experiences. Climate change is happening because of human activities, and these patterns have changed as a result. The Intergovernmental Panel on Climate Change (IPCC) states that humans have warmed the air, oceans, and land. This warming is occurring almost everywhere. In simple terms, the more heat-trapping gases there are in the atmosphere, the warmer the Earth becomes. Thus, this warming causes changes in weather around the world.
The Natural Greenhouse Effect and Human Emissions
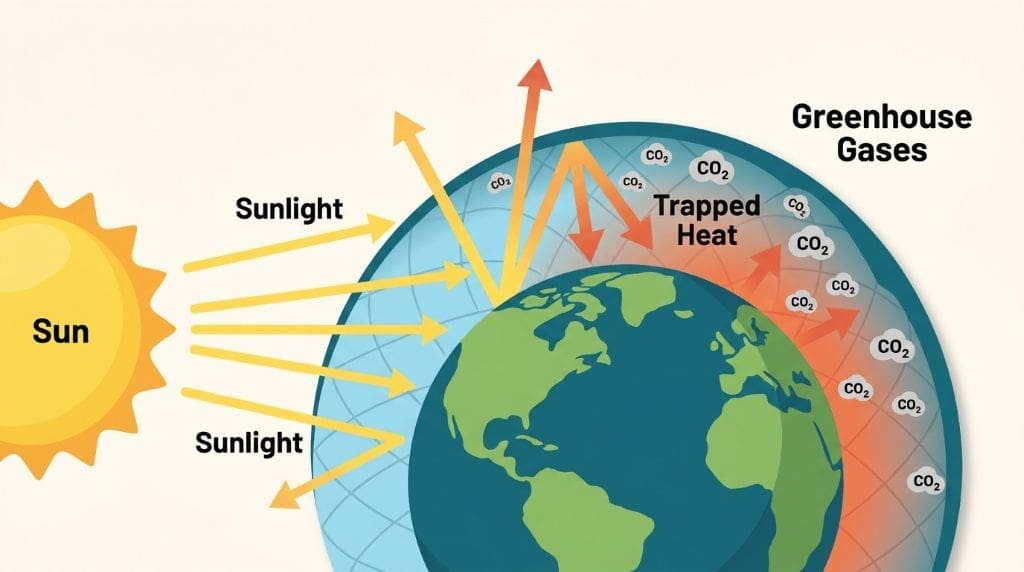
The greenhouse effect is a natural phenomenon. Gases such as carbon dioxide and methane allow sunlight to enter but prevent some heat from escaping. Without these gases, Earth would be far too cold for life to exist. Burning coal, oil, and gas has introduced too much carbon dioxide, methane, and nitrous oxide into the atmosphere. As a result, the atmosphere traps more energy, and the planet is warming. The main question now is by how much these additional gases have altered the atmosphere.
The Blanket Analogy
The idea of viewing Earth’s atmosphere as a blanket surrounding the planet is a reasonable one. A thin blanket keeps you warm, but too many layers make you too hot; each year we add more layers in the form of greenhouse gases, which causes the Earth to warm. This is just an example because greenhouse gases trap certain kinds of energy, not heat, as a blanket does. Nevertheless, the analogy helps illustrate how more gases lead to more warming.
Weather or Climate?
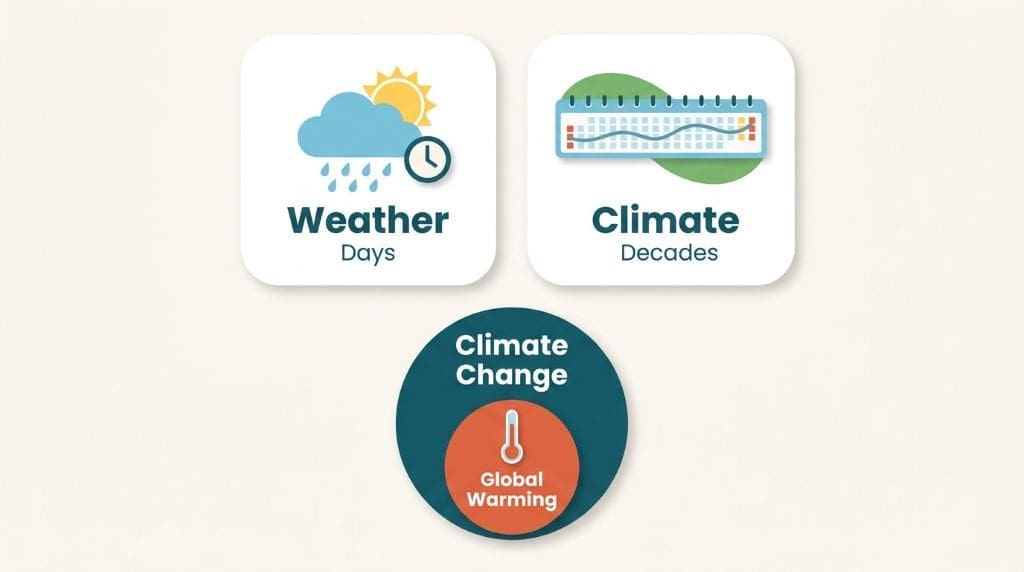
It’s simple to confuse ‘weather’ with ‘climate’. For instance, a cold week doesn’t mean global warming isn’t happening, and a single hot day doesn’t prove it is. Weather refers to what is happening outside at present or over a short period of a few days. Climate is the typical weather pattern that is observed over many years. ‘Global warming’ means the Earth’s average temperature is increasing; ‘climate change’ refers to all the changes that have taken place, not just the temperature rise. Natural fluctuations can occur, such as during El Niño years, but these differ from long-term climate change.
| Term | Simple definition | Time frame |
| Weather | Short-term conditions: rain, wind, heat, storms | Hours to weeks |
| Climate | The average pattern of weather in a region | Decades or longer |
| Global warming | The rise in Earth’s average surface temperature | Multi-decade trend |
| Climate change | All long-term shifts linked to warming, including rainfall, ice, and seas | Multi-decade trend |
| Climate variability | Natural fluctuations around the trend, like El Nino cycles | Years to decades |
Global Warming vs Climate Change: What Is the Difference?
The two phrases have something in common but are not the same. Global warming involves an increase in Earth’s average surface temperature. In contrast, climate change refers to the whole range of effects. As the average temperature rises, more energy and moisture enter the atmosphere, shifting storm tracks so some areas become drier while others experience flooding. At the same time, the oceans absorb most of the trapped heat, and their chemistry changes as carbon dioxide dissolves in seawater. That is why scientists say warming is the cause and that climate change provides the more comprehensive explanation. Students should therefore maintain the distinction between the two terms to make more informed judgments when reading news reports and scientific summaries.
Think About It
Imagine a classroom scenario: when a class records the highest temperature each day for a month and compares it with the region’s 30-year average, the temperature will be above that average on some days and below it on others, illustrating natural variability. However, over several years, the data show a clear trend. This type of thought experiment teaches the same skill climate scientists use: distinguishing between noise and a trend.
Why Does Climate Change Matter?
Climate change matters because it affects the systems people depend on every day. Rising global temperatures don’t stay in the atmosphere; they are spread to the oceans, ice, soils, and living communities, all of which support human life. Consequently, this affects health, food security, biodiversity, and water resources. Planning areas also face this kind of pressure. Furthermore, these effects strengthen one another: in the same area, a hotter season can lead to a smaller harvest, higher food prices, and a greater strain on household budgets. When students consider this chain of consequences, they can understand why scientists see the problem as both urgent and solvable.

How Rising Emissions Lead to Wider Impacts on Climate Change
A clear progression links emissions to their effects. The more greenhouse gases emitted, the more heat is trapped and the higher the average global temperature becomes. Because warmer air holds more moisture, some places see heavier rainfall while droughts worsen in others. At the same time, scientists have found that tropical storms have become more intense. They have measured all stages of this sequence with instruments and reconstructed it from historical records. Overall, the more warming there is, the more severe and frequent the disruptions become, even though specific outcomes vary by region and depend on how quickly societies adapt.
What the Research Shows About Biodiversity and Food
Evidence on ecological effects and evidence on human well-being generally come from different studies and must be kept separate. On the ecological side, a global review of climate change, biodiversity, and food security (Muluneh, 2021) combines several modelled scenarios. It notes that in climate-and-migration modelling, species’ distributions have shifted to higher elevations at a median rate of 11.0 metres per decade and 16.9 km per decade towards higher latitudes. For the 1,103 species covered by the migration scenarios, the expected extinction risk is 21 to 23 per cent if migration is unlimited and 38 to 52 per cent if there is no migration. Once more, these figures are the results of the scenarios, not observations for every species everywhere.
Food Security Risks and Warming Trajectories
The review also examines the connection between food systems and human welfare. Climate change will most severely damage food security in rain-fed agricultural communities by pushing crops and plants beyond thresholds that reduce their growth and yield. Furthermore, if adaptation fails, modelled yields in Africa could drop by more than 30% by 2050. An independent review of greenhouse-gas trends and policy commitments (Shivanna, 2022) says that COP21 established a target of limiting warming to well below 2°C, preferably 1.5°C, while an analysis of the emission pathways and the pledges made at COP26 shows that implementing those pledges would still produce about 2.4°C of warming, and unabated emissions would produce 3 to 4°C. Note the access caveat below: before publishing, verify the open-access status of this article and consider its projections in light of UNEP’s Emissions Gap Report.
What Causes Climate Change?
Human activity drives the current warming, and it does so across several sectors. Burning coal, oil, and natural gas releases carbon dioxide, deforestation turns forests from carbon sinks into sources, cement and steel production release further gases, and livestock, rice paddies, and fertilisers add methane and nitrous oxide. Natural factors do play a role: solar cycles slightly alter sunlight, volcanic eruptions cause temporary cooling, and slow orbital changes drive the ice ages. However, today’s warming shows a distinct pattern. It is fastest at night and in the Arctic, and while the lower atmosphere warms, the upper atmosphere cools. This matches the physics of greenhouse gases, not solar or volcanic explanations. Hence, the IPCC AR6 concludes that human influence is responsible for essentially all warming observed since 1850.
The Main Greenhouse Gases You Should Know
All different greenhouse gases act in different ways, which is why it’s necessary to study them. Carbon dioxide is the most widespread and remains in the atmosphere for hundreds of years. Although methane traps much more heat per molecule, it breaks down after about ten years. Nitrous oxide is long-lasting and linked to farming. The fluorinated gases are in small amounts but have a very strong warming effect. Just as important as the kind of gas is the source of the emissions.

- Carbon dioxide (CO2), from burning fossil fuels, deforestation, and cement production, is the primary cause of warming.
- Methane (CH4) comes from livestock, landfills, rice, and leaking fossil fuel infrastructure.
- Nitrogen fertilisers release nitrous oxide, as do industrial processes.
- Fluorinated gases used in refrigeration, air conditioning, and manufacturing have a very high global warming potential, even in small quantities.
These gases enter the atmosphere through human activities, and scientists can identify a clear signature in each case. Isotope analysis lets scientists distinguish fossil carbon from other carbon sources. Nowadays, satellite sensors can detect methane plumes that were previously undetectable. For this reason, the figures in the inventory improve each year. At the same time, natural sources and sinks keep changing as ecosystems respond to warming. That is why researchers continue to improve their estimates rather than treat them as final.
Greenhouse Gas Sources: What IPCC and WMO Data Show
The table below shows the main emission sources based on the most recent verified global figures. The WMO Greenhouse Gas Bulletin, released in October 2025, provides the concentration figures and includes 2024 data. This bulletin pointed out the largest single-year increase in carbon dioxide since continuous observations began in 1957. The final row of the table explains that higher concentrations strengthen the greenhouse effect and therefore raise global temperature. Remember this sequence when you take part in the class discussions.
| Greenhouse gas | Main human sources | Atmospheric lifetime | Global concentration (2024) |
| Carbon dioxide (CO2) | Fossil fuels, deforestation, cement | Centuries (a fraction persists much longer) | 423.9 +/- 0.2 ppm |
| Methane (CH4) | Livestock, landfills, rice paddies, fossil leakage | About a decade | 1,942 ppb |
| Nitrous oxide (N2O) | Fertilizers, industrial processes | About 120 years | 338.0 ppb |
| Fluorinated gases | Refrigeration, air conditioning, manufacturing | Years to thousands of years | Trace levels, rising |
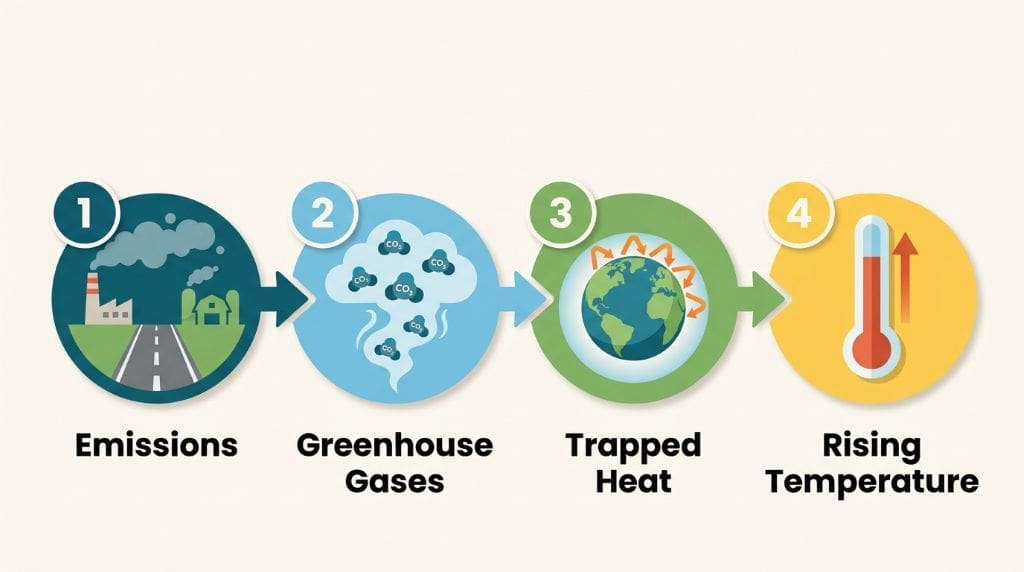
Emission source -> Atmospheric greenhouse gas -> Enhanced greenhouse effect -> Global temperature rise
The example shows how a factory, a farm, or a highway can contribute to a warmer planet. The impact increases over time if we focus on a single aspect, since each year adds more gases while emissions from previous years remain. Since the process is cumulative, the choices we make today will determine the climate that today’s students will inherit.
Is Climate Change Altering Ecosystems and Biodiversity?
Warming affects living systems at every level, from individual species to entire landscapes. Species, both animals and plants, are moving toward cooler areas, up mountains and toward the poles. At the population level, breeding and migration timing is changing. Meanwhile, the communities of species that once shared an area are now separating, breaking apart partnerships that existed for millennia. Finally, at the ecosystem level, the coral reefs bleach, wetlands shrink, and forests face new pests and different fire regimes. To sum up, climate change acts as a stress multiplier on existing habitat loss, pollution, and invasive species.
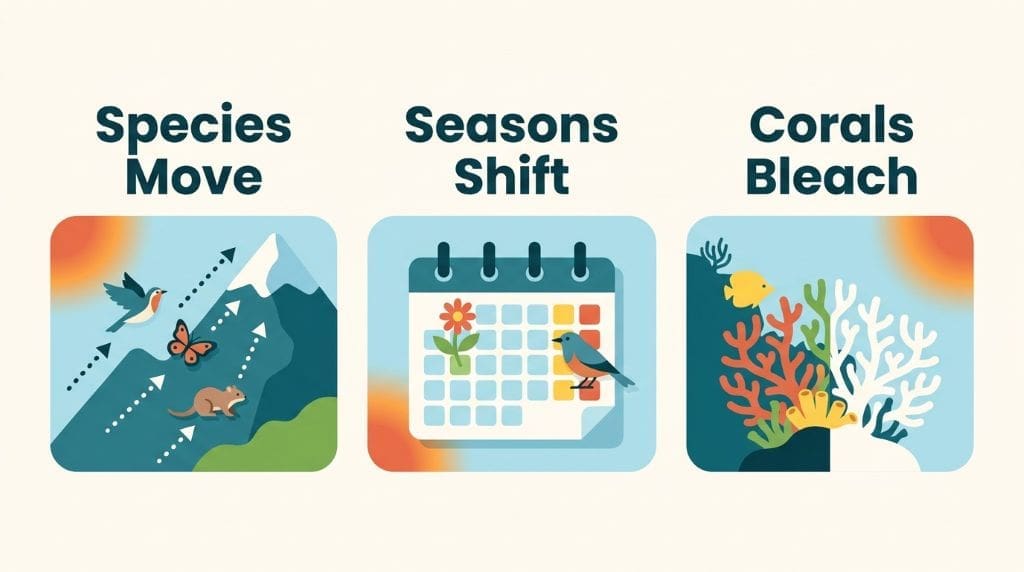
The timing of seasonal events, a field called phenology, offers the most obvious warnings. Today, many plants flower earlier than in the past, and some birds arrive after the peak of their insect food supply. This creates mismatches that affect food chains. At the same time, species that evolved in stable conditions are suffering from warmer streams, longer fire seasons, and hotter nights. Although most ecosystems have so far made only partial adjustments and have not completely collapsed, the space for adjustment is shrinking as warming continues. As a result, conservation planning now treats climate as a major variable rather than a background condition.
Range Shifts and Phenology: What the Evidence Shows
Two studies illustrate how researchers record these changes. The first is Muluneh’s (2021) review, which compiles the modelled range shifts and the extinction-risk scenarios referred to earlier. The second is a conservation-focused review that examines the effects of climate change on marine coastal ecosystems (Tregarot et al., 2024). It draws upon 946 studies from 295 research articles relating to the Caribbean Sea, the Mediterranean Sea and the North-East Atlantic. This review covers coral reefs, mangrove forests, seagrass beds, maerl beds, salt marshes, kelp forests and the Mediterranean coral Cladocora caespitosa. Responses vary by species and by local conditions; locally manageable factors such as nutrient enrichment, coastal development, anchoring, and sedimentation interact with climate-related pressures and reduce resilience. The claim must remain confined to these ecosystems and should not be extended to all wildlife.
How Climate Change Compounds Other Environmental Stressors
The effects of climate change, combined with other stressors, are just as significant on land as they are in rivers. In a 2013 framework analysis, Staudt and colleagues identified four ways that climate change interacts with other stressors. For instance, rising stream temperatures directly harm native salmon in California’s Central Valley, while warmer water also favours non-native salmonids that compete with native species. Furthermore, irrigation withdrawals can reduce available water, causing it to warm more quickly and worsening the problem. The same study notes that models forecast a contraction in the ranges of many land bird species by 2050 and 2100, with climate change as the primary factor in temperate areas and land-use change in the tropics.
Regional Examples: Phoenix Heat and Canada Wildfires
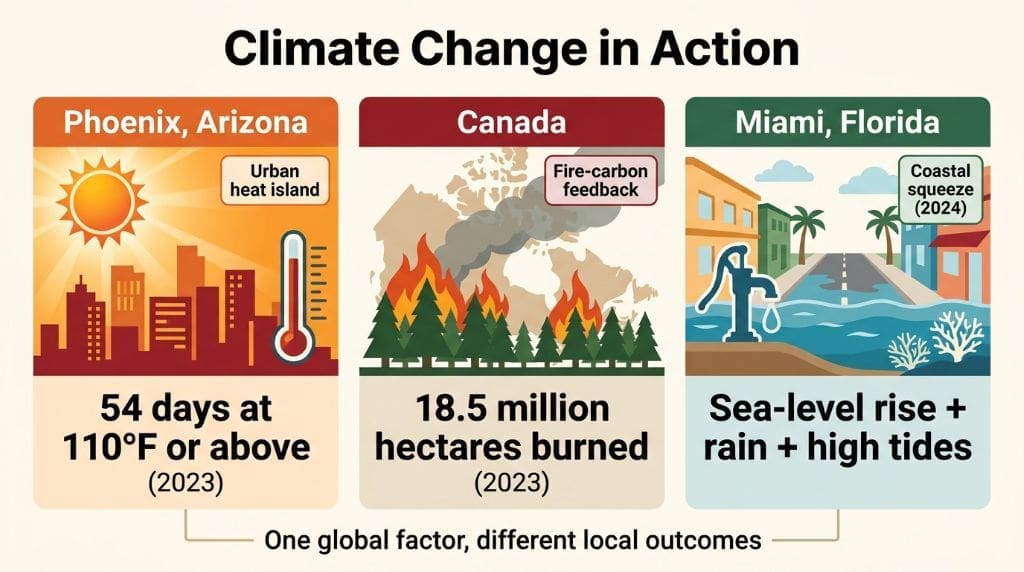
Examples from various regions make the trends clearer and should therefore be shown this way rather than as general averages. In Phoenix, Arizona, the National Weather Service recorded 54 days at or above 110 F in 2023, including a record 31-day period; media and agency reports indicate this rose to nearly 70 in 2024, setting a new record. In Canada, the area burned during the 2023 wildfire season was about 18.5 million hectares, which is considerably higher than the ten-year average; in 2025 it was approximately 8.8 million hectares, more than twice the ten-year average and the second-worst on record. Each case shows how local conditions interact with global warming rather than following a uniform pattern.
Climate Change Impacts on Food Security and Water Resources
Food security depends on availability, access, stability, and use, all of which are disrupted by warming. Heat waves interrupt pollination and grain filling at critical growth stages. At the same time, droughts limit irrigation and excessive rain floods fields and erodes topsoil, hitting households hardest and turning climate shocks into economic and public-health crises. Water resources amplify this vulnerability: as glaciers and snowpacks shrink, downstream farms lose drought security, and warmer water temperatures with altered flow patterns further stress fisheries and irrigation timing. Regions already facing water shortages—large parts of Africa, South Asia, and the Middle East—face the greatest risk, since millions depend on rain-fed agriculture. Adaptation measures like drought-resistant crops and efficient irrigation are therefore particularly valuable in these vulnerable areas.
Rain-Fed Agriculture: Why It Is So Vulnerable
Because rain-fed agriculture relies completely on the timing and amount of rainfall, it can be affected by even small changes. For instance, if the monsoon is delayed or the rainy season fails, a family could end up with no harvest. As Muluneh (2021) notes, crops have limits beyond which both growth and yield decrease, and the review shows that modelled crop yields in Africa could drop by more than 30% by 2050 because of climate change. The same review also links biodiversity loss to food security, because wild species contribute to pollination, pest control, and soil health; wild relatives of crops also supply the genetic material needed to breed stress-tolerant varieties.

Africa’s case illustrates both its vulnerability and its capacity to respond. According to a systematic review of the effects of climate change on African biodiversity and ecosystem services (Sintayehu, 2018), climate change has shifted species distributions, populations, and phenology, and it will continue to do so, with consequences for food and livestock production, disease regulation, and carbon sequestration. The review notes that habitat fragmentation, along with other pressures, increases risk, and it suggests that adaptation and conservation planning should explicitly account for biodiversity. Expanding farmland or catching new fish stocks cannot solve food shortages without damaging the ecosystems that long-term production needs.
Flooding, Sea Level, and Communities: Miami’s Example
Rising sea levels show how climate change affects city infrastructure and vulnerable communities. The World Meteorological Organisation’s 2025 climate report states that global mean sea level is rising by about 4.7 millimetres a year, roughly twice the rate measured when satellite monitoring began in 1993. On Virginia Key in Miami, NOAA’s tide gauge shows sustained coastal rise, and high-tide flooding has increased from a rare event in the 1990s to about twelve days a year. This threatens streets, septic systems, and drainage networks. NOAA projects that U.S. sea levels will rise 10 to 12 inches by 2050, bringing more flood days. Climate justice is also a concern, because poorer neighbourhoods flood first and recover most slowly, which deepens existing inequalities.
How Are Earth’s Physical Systems Responding?
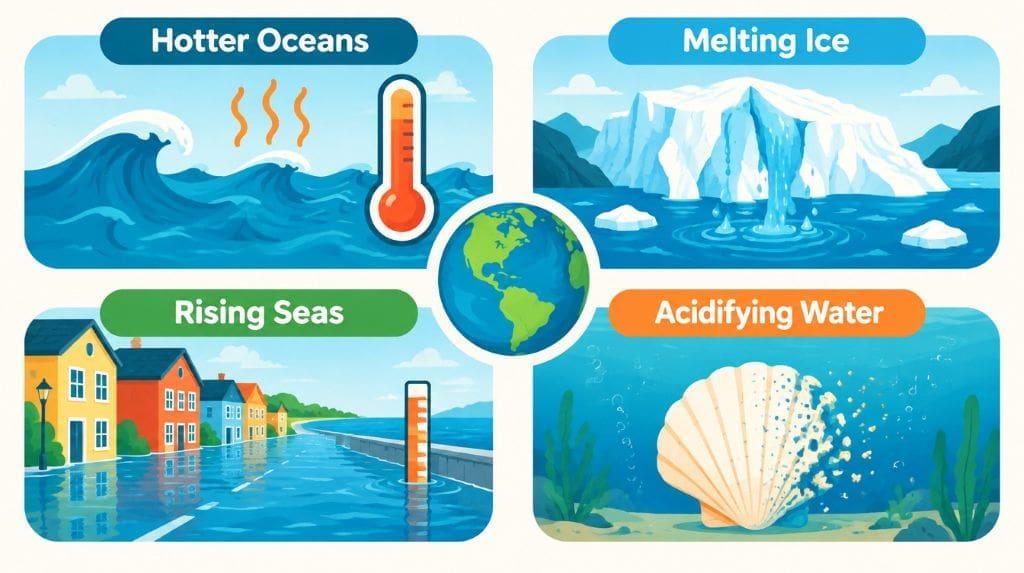
Scientists are now able to directly observe the way physical systems react to warming because extreme heat events have become more frequent and more intense. Heavy rain now tends to arrive in shorter bursts, which means that both floods and droughts can affect the same area in the same year. Glaciers and ice sheets are losing mass, and the resulting meltwater is causing sea levels to rise. Moreover, the oceans absorb around nine-tenths of the extra heat trapped by greenhouse gases, and this in turn leads to marine heatwaves and coral bleaching. These responses influence one another, forming a network rather than a simple list, and scientific uncertainty remains within the system.
Record Ocean Heat, Glacier Loss, and Acidification
The most recent WMO figures illustrate just how quickly things are changing. In 2025, the oceans recorded heat absorption, and eight of the ten most negative annual glacier mass balances since 1950 took place after 2016. Furthermore, ocean acidification is also a serious issue. Carbon dioxide reacting with seawater produces carbonic acid, which causes the pH to drop and decreases the number of carbonate ions that shellfish, corals and plankton need in order to form their shells. As a result, marine ecosystems are under triple pressure due to increasing temperatures, acidification and the loss of oxygen. It is the people living in coastal areas who rely on reefs and fisheries who experience these changes.
Ecological Feedbacks and Why They Matter
Ecosystems do not just absorb change; instead, they produce feedbacks which can either amplify or reduce it. A major review in Earth’s Future from 2026 on ecological feedbacks in the Earth system (Murphy et al., 2026) explains how the interactions between organisms alter the physical and chemical processes in marine, freshwater, and terrestrial systems. The study cautions that climate change and other human effects currently interfere with ecological processes and that the Earth system could be subject to sudden disturbances. The authors have established three research priorities: incorporating ecological feedbacks into global assessments and models, mapping them at different scales, and producing projections that are appropriate for policy advice. In short, climate physics alone is not enough; ecology belongs in the picture too.
How Climate Change and Land Use Reinforce Each Other
The issue is further complicated by land use. A literature review published in Global Challenges on the interaction between climate change and land-use/cover change (He et al., 2019) shows that climate change can decrease a species’ ability to cope with land-use change, while land-use change in turn reduces the resilience of ecosystems to climate change. The effects referred to are range shifts, altered species interactions, changes in richness and abundance, increased extinction rates, nutrient deposition, and habitat fragmentation. A further significant point is that the two factors tend to reinforce one another, and concentrating on just one while neglecting the other provides only partial protection.
What Is a Climate Tipping Point?
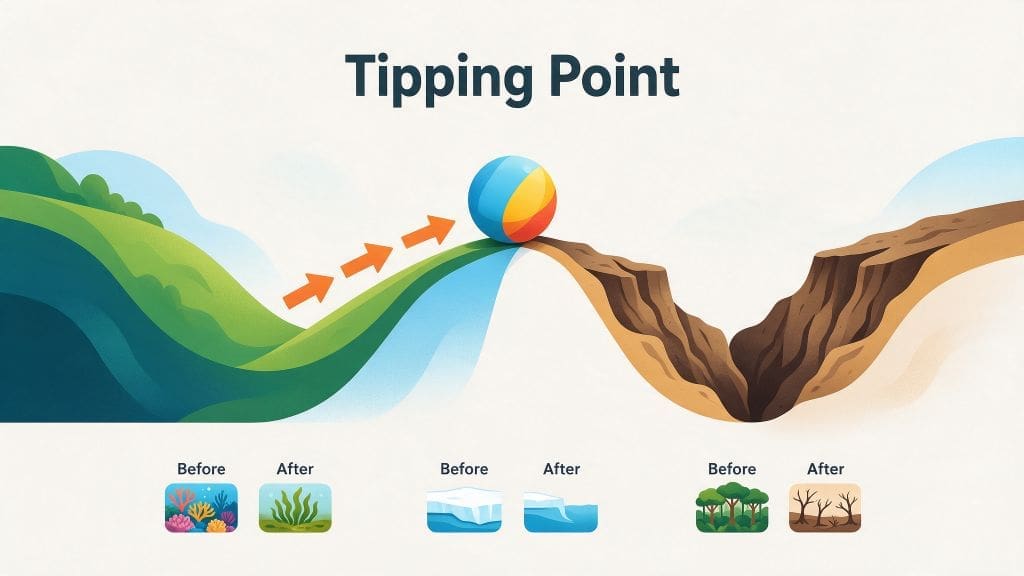
A tipping point is a threshold beyond which a system reorganises itself into a different state, a change that, in certain instances, is irreversible over human timescales. Coral reefs can transform into algae-covered formations, and rising temperatures can push ice sheets past a tipping point where they continue retreating even if temperatures subsequently decrease. Similarly, rainforests can become dry when they pass the point at which they are no longer able to recycle their own rainfall. Scientists point out that there is still a high level of uncertainty regarding these thresholds, and in some cases the alleged tipping points are still in dispute. Yet the direction of the risk is clear: the greater the pressure applied, the nearer systems get to sudden change. At present, the evidence indicates that a precautionary approach should be taken rather than one of panic.
What Are Planetary Boundaries, and Why Do They Matter?
Planetary boundaries define the limits within which human activity can safely take place on a changing planet. Updated by Steffen and colleagues in 2015 and published in Science, the framework sets science-based limits on human impact on the major processes of the Earth system. As long as humanity stays below a boundary, the risk of disrupting the Holocene-like conditions that have supported civilisation remains low. Once it enters the zone of uncertainty, that risk grows. The framework combines Earth system science with the precautionary principle and treats the boundaries as guides to risk, not legal limits. The authors stress that it is meant to inform political decisions, not make them.
The 2015 Update: Crossed Boundaries and Core Processes
In the 2015 update, the authors reinforced a number of boundaries and introduced regional levels. At present, human activity has pushed four processes beyond the proposed boundaries: climate change, biosphere integrity, biogeochemical flows, and land-system change. Moreover, the authors have designated two of the boundaries as core because of their fundamental significance: climate change controls the energy balance at Earth’s surface, and biosphere integrity regulates material and energy flows and gives the system resilience against abrupt change. The consequence of this is that damage to either of the two core boundaries can cause the entire system to move towards a new state. The students need to realise that these two constitute the levers having the greatest impact.
Limits and Uncertainties: Interpreting the Framework
It is just as important to interpret the framework responsibly as it is to know it; the boundaries do not correspond to fixed regulatory limits and their precise locations do involve a degree of judgment and uncertainty. Quantified global limits are still missing for some processes, for example, atmospheric aerosol loading, novel entities, and certain aspects of biosphere function. To sum up, the framework indicates the risks rather than giving a final assessment. The original article is behind a paywall; therefore, for a free introduction to the concept, refer to the summary from the Stockholm Resilience Centre or the open commentary literature. Caution should be exercised when using the graphic versions since the values are revised as scientific knowledge advances.
How Do Scientists Study and Monitor Climate Change?
The fact that climate change is real comes from agreement across many independent lines of evidence. Satellites gather information on temperature, sea level, ice coverage, and vegetation from orbit. Ground stations keep records of surface conditions at thousands of places. Ocean buoys and Argo floats measure heat and salinity below the ocean surface. Air trapped in ice cores reveals past carbon dioxide levels, while tide gauges monitor sea level over many centuries. In each of the major assessments, scientists use the data from these various systems and then modify each record to make them agree.

Climate Models and Earth System Models
Models convert observations into understanding and enable forecasts. As stated in an article in Earth-Science Reviews on the evolution and future of Earth system models (Pan et al., 2025), the development of these models has moved from simulations that focused only on the atmosphere to coupled systems that also include the oceans, the ice, the land, chemistry, and human activity. The authors note the ongoing difficulties in representing the cryosphere, the lithosphere, and human activity. They also highlight the potential of multi-resolution frameworks and data-driven machine learning, provided they remain interpretable and robust. The takeaway is clear: improved science relies on both physical theory and intelligent data methods.
From Observation to Report: How Climate Science Reaches the Public
Credibility in science is achieved through repeated testing and a thorough examination, not through individual studies. For example, a research team could combine monitoring data with simulation models. Le et al. (2023), who published in the journal Water Research, look at how aquatic macroinvertebrates react to climate change. The authors link a basin-scale hydroclimate-salinity model with statistical models that they have developed from long-term monitoring data collected along 2,300 km of the Murray River in Australia. Using their causal modelling method, they predict changes that vary from place to place and over time in terms of flow, salinity, temperature, turbidity, and biological indicators, and they expect most of the anticipated biological responses to be negative throughout most of the modelled period. The authors do, however, warn that the predictions are still only tentative due to the uncertainties involved in both the models and the scenarios.
The Research-to-Policy Pipeline
Observations (using satellites, sensors, and records) are followed by data analysis and modelling. Peer review follows, after which assessment reports (such as those of the IPCC) are prepared, and finally, public communication. Because large reports like those prepared by the IPCC take a long time to produce and require the involvement of hundreds of scientists, experts, and government agencies, drafts are reviewed, and the reports themselves state that uncertainties exist. For this reason, the summaries have a major influence on policy discussions. By contrast, students can carry out a smaller version of the How Assessment Reports Shape Policy and Inspire Student Research procedure in the classroom by gathering local data, testing a simple hypothesis, and then comparing their results with those that have already been published.

Case Studies – Climate Change in Action
Case studies link general trends to specific locations and must be regarded as examples coming from a particular area. The three mentioned here are well documented and have been widely reported. In every case, there is a measurable climate signal together with observable effects on both people and ecosystems. In each instance, adaptation decisions result in both costs and opportunities. Taken as a whole, they demonstrate a clear pattern: the same global factor can cause different local outcomes.
Case 1: Phoenix, Arizona: Extreme Heat as a Regional Signal
Phoenix holds one of the most distinct urban heat records in the United States. The National Weather Service reported that 54 days in 2023 reached or went above 110 F, comprising a record-long stretch of 31 days; similarly, the agencies mentioned around 70 days like this in 2024. Overnight temperatures also remained unusually high, which stopped residents from being able to cool down. The city’s expansion, the amount of asphalt, and the lack of shade all lead to background warming, a phenomenon called the urban heat island. Measures that have been taken include establishing cooling centres, planting trees, and using reflective surfaces. Yet since the fundamental cause is global, local actions only deal with the symptoms, whereas reductions in emissions aim at the root cause.
Case 2: Canada’s Wildfires: A Fire-Carbon Feedback
In Canada, the fire season of 2023 burned an area of about 18.5 million hectares, setting a new record higher than any previous one, and smoke spread over all of North America; in 2025, the fire season saw the burning of approximately 8.8 million hectares, which is more than double the ten-year average and the second worst on record, while 2024 also fell into the category of severe years. Since fires release stored carbon and, following a burn, forests absorb less carbon dioxide, wildfires are connected to the carbon cycle. Yet it is hard to blame any single fire season because a number of factors—such as weather patterns, forest management and human-caused ignitions—contribute to the situation. This instance illustrates how warming extends fire seasons and dries out the fuel.
Case 3: Miami and the Coastal Squeeze
Miami’s flooding comes from sea-level rise, heavy rain, and high tides acting together. A review of the effects of climate change on coastal ecosystems (Guild et al., 2024) shows that warming, marine heatwaves, sea-level rise, acidification, and changing freshwater flow all stress coastal habitats, and that combined pressures can exceed what ecosystems can adapt to, weakening coastal protection and fisheries. Miami shows this squeeze in practice: corals in the surrounding waters are at risk of bleaching, while the city spends heavily on pumps and raised infrastructure to keep the water out.
What is Possible? The Solutions and What Students Can Do
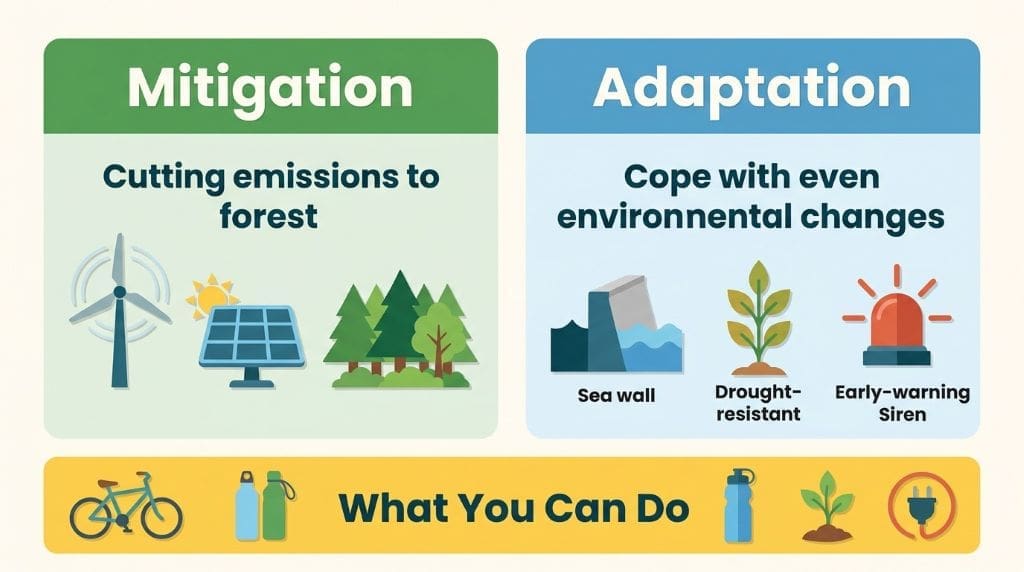
The answers can be divided into two main types, both of which are important. Mitigation refers to reducing emissions or getting greenhouse gases out of the atmosphere, whereas adaptation means reducing the damage caused by changes that have already taken place. Measures falling under the first category include quickly expanding renewable energy, improving energy efficiency, protecting forests, and using cleaner industrial processes. Those in the second category are resilient infrastructure, early-warning systems, drought-resistant crops, and flood defences. A study carried out by Shin and his colleagues in 2022 discovered that direct climate mitigation produced co-benefits for 14 out of the 21 action targets in the draft post-2020 global biodiversity framework. To put it simply, effective conservation usually also has benefits for the climate.
How Policy Tools and Citizens Drive Climate Action
Policy tools implement these initiatives in different economies by getting polluters to pay for their emissions and prompting the market to move towards cleaner alternatives. Once international agreements have established common targets and reporting rules, national commitments turn these targets into law and allocate budgets—for instance, by means of building regulations, land-use rules, and public investment—thus influencing the way in which cities develop over time. Furthermore, policy measures only work if citizens take part in them, which is why students should have a say at school boards and local councils.
Everyday Choices and Classroom Ideas
It is impossible for one action to deal with a global issue by itself, but it can help establish habits, show demand, and create momentum. Students can make a difference to the way their households use energy, the means of transport they select, their diet, and their consumption habits. The choices they make then affect the decisions of their families and the norms that exist in their community. The list below offers some practical steps for student life, and the paragraphs that follow describe how one can go further by carrying out structured projects.
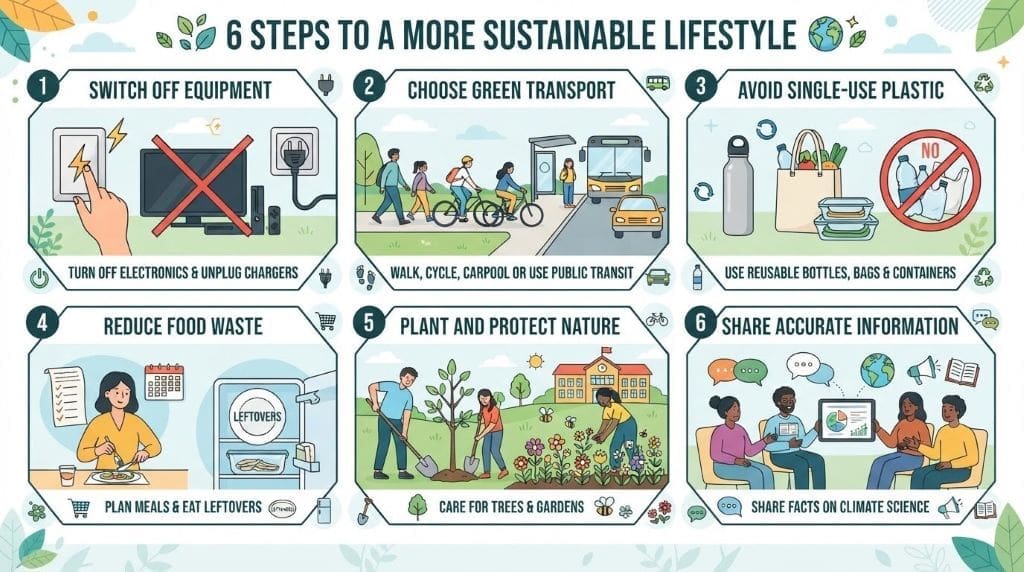
Projects turn an interest into a skill. Students have the option of auditing the school’s energy use, taking local temperature measurements, or making a map that shows the shade on campus. Such activities help to develop data literacy and lead to results that are important to the school community.
Frequently Asked Questions About Climate Change for Students
The term climate change means long-term changes in the Earth’s average temperatures and in its weather patterns, mainly since people have released greenhouse gases. It has an impact on ecosystems, food systems, extreme weather events, and human communities. Since scientists study it over a period of decades, a single season is not sufficient to prove or disprove the trend.
Global warming refers to the rise in the average surface temperature of the Earth. The wider range of changes that result from it—such as changes in the amount of rainfall, the melting of ice, increasing sea levels, and more extreme weather conditions—makes up what is known as climate change. Global warming is just one part of the general climate change problem.
Carbon dioxide, methane and nitrous oxide are given off as a result of burning fossil fuels, deforestation, industrial processes and agricultural activities. These greenhouse gases hold heat and stop it from escaping into space. Yet natural factors such as solar cycles and volcanoes also play a role; the IPCC AR6 says that human activity has been responsible for almost all of the warming observed since 1850.
The ranges of species are moving towards cooler areas, and seasonal events like flowering and breeding are taking place earlier. Corals become bleached, their habitats shrink, and the risk of extinction rises. Together with present-day pressures such as habitat destruction, pollution and invasive species, these effects make it harder to predict the impacts.
Heat, longer periods of drought, floods, and changes in rainfall patterns lead to a decrease in both crop production and the productivity of livestock, particularly in areas where farming is based on rainfall. A global review predicts that agricultural output in Africa might drop by more than 30 per cent by 2050 due to climate change. The effects are clearly seen not only in the amount produced on farms but also in people’s access to food, the prices of food, and their nutritional intake.
A planetary boundary is the degree of pressure which human activity exerts on a major process in the Earth’s systems, as established on the basis of scientific evidence, and remaining below it ensures that the related risks are kept low. Steffen and his colleagues (2015) regarded climate change and biosphere integrity as the main boundaries and discovered that four processes had already gone beyond the limits which they had set.
This is supported by thousands of measurements, including data obtained from surface and ocean thermometers, satellite observations, ice cores, tide gauges, and weather balloons. There are numerous independent records that show the same warming trend since the 1800s, and other scientists look at each piece of evidence before it is published.
A tipping point refers to a threshold past which a system shifts into a new state that is difficult to reverse, such as in the case of coral reefs dying out or ice sheets shrinking beyond the point at which recovery is possible. Even though scientists caution that the combined effect of various pressures increases the likelihood of crossing these thresholds, many of the specific details are still uncertain.
Some effects, for example, higher sea levels and the extinction of species, cannot be readily reversed. It is still possible to prevent global warming from getting worse by cutting down on emissions and thus enabling many ecosystems to recover. Since reversal can only be partial, the main aim of climate action ought to be to keep the total warming as low as possible.
Pupils have the opportunity to lower their energy consumption, reduce waste, protect green spaces, and pass on reliable scientific information at school. If they carry out projects that involve monitoring local temperature, carbon footprints, or air quality, they will develop their abilities and collect evidence. Moreover, by giving talks at school councils or at community meetings, they can influence those who make decisions to take more effective climate action.
According to the IPCC AR6, the warming seen between 2011 and 2020, when compared to the period 1850 to 1900, was about 1.09°C; the WMO stated that 2024 was the hottest year ever recorded, with the temperature roughly 1.55°C above the baseline, and its 2025 report notes that 2025 reached about 1.43°C. The different datasets show only small differences, and the period from 2015 to 2025 includes the 11 hottest years on record.
Your Climate Change Learning Pathway for Students
The best method for studying climate change is to follow a systematic sequence rather than to tackle the subject in a random way. You should start off by looking at the basic definitions, then move on to the causes and the gases involved. After that, think about ecosystems and food systems before considering the physical systems and tipping points. Then, find out how scientists keep an eye on the planet, and finally look at the possible solutions and actions. Each step relies on the one before it and is linked to something you are already studying at school. To sum up, this approach illustrates how science has developed over the past two centuries.
Beginner level: An explanation of what climate change is – the reasons behind it and the greenhouse gases involved – the effects it has on ecosystems and on food security – the Earth’s physical systems and the tipping points – how scientists investigate climate change – and the solutions along with things that students can do.
Linking Climate Science to Your Career
In the end, you should link the science to your career opportunities since climate studies cover chemistry, biology, ecology, geography, and public policy and thus can lead to an interest in a wide variety of subjects. There are career opportunities in atmospheric research, urban planning, renewable engineering, and environmental law. Since there are so many possibilities, almost any interest can be matched with an appropriate role. It’s a good idea to look into careers in climate science and sustainability in order to get an idea of the variety on offer. The hub will eventually provide a link to each of the supporting cluster articles when they are published, and the pathway mentioned above is the way recommended for navigating them.
How This Guide Was Compiled
The article draws on peer-reviewed papers, open-access reviews, and official climate reports. While preparing the 2026 update, we focused on sources readers can access for free. When drafting the article, we checked the main global figures again against the most recent statements from the WMO, NASA, Copernicus, and NOAA. Several regional data points are still marked in the source-check table below and will need to be confirmed before the article is published. All the claims made in the article can be traced to the references listed at the end. We linked each statistic to its source and use the term ‘scenarios’ rather than ‘observations’ when referring to modeled outputs. Additionally, the regional figures match those of the reporting agency named in the appropriate section. When the figures designated for re-check are published, update them here. This level of editorial transparency ensures accuracy and helps maintain reader trust.
Verified Resources
- The Report of the IPCC AR6 Working Group I and the summaries of that report are available at ipcc.ch/report/ar6/wg1
- The WMO’s assessment of the global climate can be found at wmo.int/publication-series/state-of-global-climate
- Greenhouse Gas Bulletin of the WMO – wmo.int/publication-series/greenhouse-gas-bulletin
- Climate reports from the NOAA National Centres for Environmental Information – ncei.noaa.gov
- The high-tide flooding records kept by NOAA – at tidesandcurrents.noaa.gov
- NASA climate and sea level change websites: climate.nasa.gov and sealevel.nasa.gov.
- Copernicus Climate Change Service, climate.copernicus.eu
- Indicators of global climate change. indicators.climate.copernicus.eu
- MIT Climate Portal (educational, .edu). climate.mit.edu
References
- Guild, R., Wang, X., & Quijon, P. A. (2024). Climate change impacts on coastal ecosystems. Environmental Research: Climate, 3(4), 042006. https://doi.org/10.1088/2752-5295/ad9f90
- He, X., Liang, J., Zeng, G., Yuan, Y., & Li, X. (2019). The effects of interaction between climate change and land-use/cover change on biodiversity-related ecosystem services. Global Challenges, 3(9), 1800095. https://doi.org/10.1002/gch2.201800095
- IPCC. (2021). Climate change 2021: The physical science basis. Contribution of Working Group I to the Sixth Assessment Report of the Intergovernmental Panel on Climate Change. Cambridge University Press. https://www.ipcc.ch/report/ar6/wg1/
- Le, C. T. U., Paul, W. L., Gawne, B., & Suter, P. (2023). Integrating simulation models and statistical models using causal modelling principles to predict aquatic macroinvertebrate responses to climate change. Water Research, 231, 119661. https://doi.org/10.1016/j.watres.2023.119661
- Muluneh, M. G. (2021). Impact of climate change on biodiversity and food security: A global perspective-a review article. Agriculture & Food Security, 10(1), 36. https://doi.org/10.1186/s40066-021-00318-5
- Murphy, E. J., Williams, J. J., Myers-Smith, I. H., Groner, V. P., Jacoby, D. M. P., Kwiatkowski, L., Cavan, E. L. (2026). Ecological feedbacks in the Earth system. Earth’s Future, 14, e2025EF006478. https://doi.org/10.1029/2025EF006478
- Pan, X., Chen, D., Pan, B., Huang, X., Yang, K., Piao, S., … Li, X. (2025). Evolution and prospects of Earth system models: Challenges and opportunities. Earth-Science Reviews, 260, 104986. https://doi.org/10.1016/j.earscirev.2024.104986
- Shin, Y.-J., Midgley, G. F., Archer, E. R. M., Arneth, A., Barnes, D. K. A., Chan, L., … Smith, P. (2022). Actions to halt biodiversity loss generally benefit the climate. Global Change Biology, 28(9), 2846-2874. https://doi.org/10.1111/gcb.16109
- Shivanna, K. R. (2022). Climate change and its impact on biodiversity and human welfare. Proceedings of the Indian National Science Academy, 88(2), 160-171. https://doi.org/10.1007/s43538-022-00073-6
- Sintayehu, D. W. (2018). Impact of climate change on biodiversity and associated key ecosystem services in Africa: A systematic review. Ecosystem Health and Sustainability, 4(9), 225-239. https://doi.org/10.1080/20964129.2018.1530054
- Staudt, A., Leidner, A. K., Howard, J., Brauman, K. A., Dukes, J. S., Hansen, L. J., Solorzano, L. A. (2013). The added complications of climate change: Understanding and managing biodiversity and ecosystems. Frontiers in Ecology and the Environment, 11(9), 494-501. https://doi.org/10.1890/120275
- Steffen, W., Richardson, K., Rockstrom, J., Cornell, S. E., Fetzer, I., Bennett, E. M., … Sorlin, S. (2015). Planetary boundaries: Guiding human development on a changing planet. Science, 347(6223), 1259855. https://doi.org/10.1126/science.1259855
- Tregarot, E., D’Olivo, J. P., Botelho, A. Z., Cabrito, A., Cardoso, G. O., Casal, G., de Juan, S. (2024). Effects of climate change on marine coastal ecosystems – A review to guide research and management. Biological Conservation, 289, 110394. https://doi.org/10.1016/j.biocon.2023.110394
- UNEP. (2024). Emissions Gap Report 2024. United Nations Environment Programme. https://www.unep.org/resources/emissions-gap-report-2024
- WMO. (2025). WMO Greenhouse Gas Bulletin No. 21: The state of greenhouse gases in the atmosphere based on global observations through 2024. World Meteorological Organisation. https://wmo.int/resources/publication-series/greenhouse-gas-bulletin/wmo-greenhouse-gas-bulletin-no-21
- WMO. (2026). State of the Global Climate 2025 (WMO-No. 1391). World Meteorological Organisation. https://wmo.int/publication-series/state-of-global-climate/state-of-global-climate-2025
- Indicators of Global Climate Change team. (2025). Indicators of Global Climate Change [2025 update]. https://indicators.climate.copernicus.eu/
