
Renewable energy is energy from natural sources which Earth’s own processes continually replenish on a human timescale (sunlight, wind, flowing water, geothermal heat, plant material). Unlike coal, oil and gas, which are consumed as a fuel is burnt, the sources of renewable energy are not depleted as they are replenished by rain, sunshine and wind. This guide looks at how each of the clean energy sources works, how the electricity grid delivers it, what the limitations are and how students in the 8-12 age group can explore it via projects, simulators and careers. It takes the clean energy sources (solar, wind, hydropower, geothermal, biomass, ocean and tidal) and links them to the real questions that students ask. It also links those ideas to fossil fuels, the electricity grid, energy storage, greenhouse gas emissions, the energy transition and STEM.
Key Takeaways
Renewables are those that come from sources that nature replenishes (sun, wind, water, the earth’s heat, biomass). In 2025, they accounted for 34% of the world’s electricity (up from 32% in 2024) even though solar and wind are intermittent and so require storage and flexible grids to be a reliable source. This guide looks at the six main source families, explains the difference between capacity and generation and shows how you can start off with the very simple tools of a multimeter and a small panel and work your way up to simulators such as SAM.

What Is Renewable Energy? A Simple Explanation
Renewable energy is all about flows rather than fuels. Sunlight is a continuous flow. Wind is a flow of air. Water is a flow between the ocean, the sky and the land. Geothermal heat is a flow of heat from the interior of the Earth. Plants regrow because of the flow of sunlight, water and soil nutrients. Each of those flows can be captured and converted into electricity, heat or motion. The key point is that the flow is not being used up as you use up a coal seam. That is the fundamental difference between renewables and fossil fuels, and it is that which underpins almost all of the engineering that follows: you capture the flow, you convert it, and you deliver it when and where you need it. Once you have that concept firmly in your head, then every subsequent topic becomes a lot easier, from panel efficiency through to grid balancing.
The word ‘renewable’ describes a timescale rather than a promise of infinity. Sunlight is effectively continuous on human timescales. Wind and rain are seasonal, but they come back. Biomass regrows in years or decades, so it’s only renewable if we don’t harvest it faster than it can regrow. Geothermal heat is replenished very slowly, so a poorly managed field can actually deplete itself faster than the heat source can replenish it. The contrast with coal, oil and gas is stark. Those were formed over millions of years, and they release carbon that had been sequestered for millions of years. The timescale is the key test. If the timescale for replenishment is far slower than the rate at which we are using it, it’s effectively non-renewable in practice even if the physics of the underlying resource would suggest it is renewable
From the Editor’s Desk
Imagine two barrels outside a classroom. One is a sealed tank which is filled once at the beginning of term. The other is under the gutter and gets topped up with every rainstorm. A school which draws its water from the sealed tank has to ration it as the level will only go down. A school drawing from the rain barrel can plan around the weather rather than scarcity. Fossil fuels are the sealed tank. Renewable energy is the rain barrel (with one caveat, which is that the rain doesn’t fall on schedule). That caveat is why storage and grid planning are important and why they are included in the definition of this rather than being an add-on.

Why Definitions of Renewable Energy Differ
Definitions of renewable energy differ because organisations measure different things. The US Department of Energy counts naturally replenishing resources (solar, wind, water, geothermal, biomass), while the IEA takes a broader low-emissions view that also includes nuclear and, increasingly, hydrogen. IRENA tracks installed capacity and jobs by technology. Since “clean” and “green energy” are used loosely in advertising, always check the source, the year, and whether a figure refers to capacity or generation.
| Term | Working definition | Source and where definitions differ |
| Renewable energy | Energy from sources that natural processes replenish on a human timescale. | US DOE (EERE) lists solar, wind, water, geothermal, and biomass. IEA sometimes folds nuclear into a broader “low-emissions” group, which DOE does not call renewable. |
| Clean energy | Umbrella term for technologies with low or zero operational emissions, including efficiency measures. | IEA and US DOE use it broadly. It can include nuclear and carbon capture, so it is wider than “renewable.” |
| Green energy | Subset of renewables with the smallest environmental footprint, usually sun, wind, and water. | No single formal standard. Marketing use is looser than technical use, so treat the label with care. |
| Sustainable energy | Energy systems that meet present needs without compromising future generations. | Rooted in the UN Brundtland framing and SDG 7. It includes efficiency and equity, not just supply. |
| Alternative energy | Any energy source offered as an alternative to fossil fuels. | Loose, context-dependent. It can include nuclear, hydrogen, or biofuels, so it is the least precise label. |
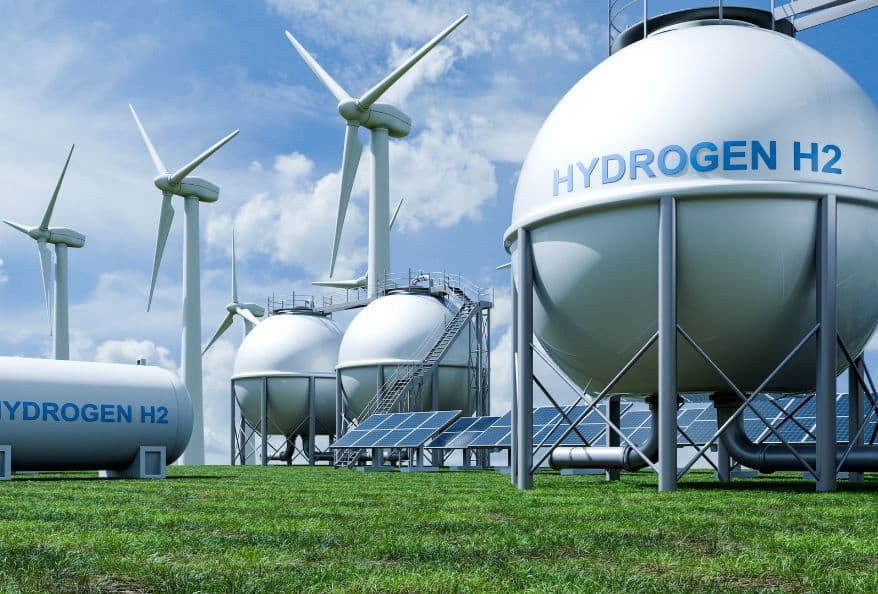
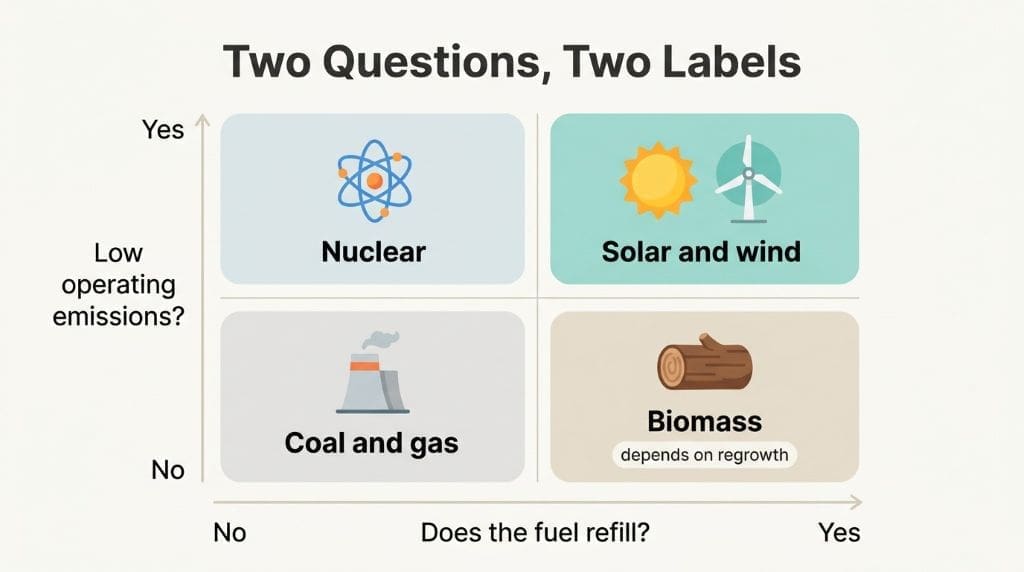
“Renewable energy” and “clean energy” often lead to the same search, but they aren’t synonymous: a nuclear plant is low carbon but not renewable, and a biomass plant is renewable but not necessarily low impact. Using the terms precisely helps students avoid assuming that every green label means zero impact or that all renewables are alike.
Why Should Renewable Energy Matter for Students?
Energy literacy is now a life skill rather than a specialist interest, and renewable energy is one of the best places for students to build it. Every electricity bill, appliance label and climate headline rests on the ideas covered in this topic. A student who understands capacity factors can read a wind farm announcement critically, and one who understands generation can see why a large solar array may produce less energy than its headline capacity implies. These are everyday reasoning skills for the numbers that shape public debate. Energy literacy also guards against exaggeration in both directions: the claim that renewables can’t work at scale and the claim that they are a panacea. Schools that teach the fundamentals give students a filter that lasts a lifetime.
The subject also brings together areas that are normally distinct. Physics provides conservation of energy, electromagnetic induction and the photovoltaic effect. Chemistry explains combustion, battery electrolytes and the semiconductor junction in a cell. Engineering contributes design constraints, efficiency and control systems. Mathematics supplies unit conversions, power curves and simple payback calculations. Environmental science covers land use, life cycle impacts and ecology. One solar project can therefore engage five departments in a single term, which is why renewable energy makes such a powerful capstone subject and features so prominently in national curricula.
Renewable Energy for Students: What the Education Research Reports
A 2026 systematic review (following PRISMA 2020) of 36 empirical studies on STEM and STEAM approaches to energy education (published 2015-2025) identified four inter-related foundations: interdisciplinarity, active/experiential learning, education for sustainable development and pedagogical contextualisation. The teaching approaches reported were PBL, inquiry, engineering design, collaboration and technology-enabled environments. Across the sample, the studies reported positive outcomes in all of the following: conceptual understanding, energy literacy, creativity, critical thinking, collaboration and problem solving (Oviedo Díaz et al., 2026). Those are the patterns that emerge from the body of work. They are not evidence that any one particular teaching method leads to any one particular gain.
Research in focus
Claim supported: STEM and STEAM are widely used in energy education and are linked to reported gains in understanding and motivation.
Oviedo Díaz, Jiménez Sierra and Bayona Velásquez (2026) synthesised 36 empirical studies (2015-2025) using PRISMA 2020 across 8 databases: 20 quantitative, 11 mixed methods and 5 qualitative. Most were non-randomised designs focused on secondary education in Asian contexts, and the authors caution against causal interpretation.
Hoque, Yasin and Sopian (2022) reviewed 25 secondary-level papers and found renewable energy curricula and practical resources thin. Knowledge, interest and awareness were generally low where teaching was minimal, while structured interventions reported positive outcomes for knowledge, attitudes and motivation. The authors flagged limited teacher expertise and recommended better materials, digital approaches and attention to family and community context, since a lesson that works in one setting may not transfer to another.
Renewables in 2025: The Global Numbers
Globally, renewables supplied about 34% of electricity in 2025, up from 32% in 2024 and about 23% a decade earlier, which is now close to coal’s output. Around 800 GW of renewable capacity was added (three-quarters of it solar), and solar generation rose by roughly 600 TWh, the largest single-year increase for any source outside post-crisis recoveries (IEA 2026a, 2026b). These are capacity and generation figures from the same source. The system is changing fast, so the jobs, tools and language students learn now should stay relevant.

Data note: The 34% share and the coal comparison come from the IEA’s Global Energy Review 2026 and Electricity 2026 (calendar year 2025). The 800 GW and 600 TWh figures come from the Global Energy Review 2026. Coverage is global, excludes heat and transport energy, and may be revised as national statistics are updated.
India’s Renewable Energy Context
India is a good example as it’s ramping up renewable capacity at the same time as it’s expanding electricity access. The MoNRE puts out a monthly state-wise installed capacity figure which breaks it down by solar, wind, bio-energy, small hydro and large hydro. That breakdown is important because the headline figure can include large hydro in one case and exclude it in another depending on the source. The Central Electricity Authority also publishes its own installed capacity and generation reports. In reality, when students are going to compare an MNRE capacity figure with a CEA generation figure, they’re comparing two different things. The habit of reading the label on each figure is the one to build, and it’s equally applicable to Indian data as it is to global data.
As for the data itself: the source for the India capacity tables is the MNRE ‘Physical Progress’ page, which is updated monthly and has its own ‘as on’ date. The generation data comes from the Central Electricity Authority reports. The policy target is 500 GW of non-fossil fuel capacity by 2030 (Government of India). The 2026 GW figures have not been independently re-checked for this article. Please see the live MNRE table for the current date-stamped value rather than a figure that has been quoted second-hand.
What Is the Difference Between Renewable and Non-renewable Energy?
The distinction is one of replenishment, not of cleanliness. A renewable resource is one which is replenished through natural processes within a human lifetime. A non-renewable resource is one which is finite on that timescale, as its formation took geological time. Coal, oil, natural gas and uranium are all in the second category. They are all stocks rather than flows. That difference is what determines everything else: the price of the resource, the length of life of a plant and what happens to the emissions when the fuel is burnt. Stock versus flow is the clearest way of making the distinction, and it holds up against pretty much any example a student will come across.
| Feature | Renewable energy | Nonrenewable energy |
| Source | Sunlight, wind, flowing water, Earth’s heat, biomass, tides | Coal, oil, natural gas, uranium ore |
| Replenishment | Continuous or within years to decades | None on human timescales; formed over millions of years |
| Typical examples | Solar PV, wind turbines, hydropower, geothermal plants, biomass boilers | Coal plants, gas turbines, diesel generators, nuclear fission |
| Emissions during operation | None or very low at the point of generation; biomass releases biogenic carbon | High for fossil fuels; near zero for nuclear operation |
| Main limits | Variability, land use, storage needs, materials, site dependence | Fuel depletion, fuel price swings, emissions, waste management |
Hydropower
Nuclear power absolutely merits its own paragraph. It’s low carbon during operation and provides baseload power, but it’s not a renewable as uranium is a finite mined fuel. The IEA and the US Department of Energy both count nuclear as part of the low carbon/clean energy mix, but don’t classify it as renewable. Students occasionally come away with the impression that this is a contradiction. It isn’t. Two distinct questions are being asked: does the fuel replenish itself, and does the generation emit greenhouse gases? Both are important, and the correct answer is to keep the two questions separate rather than lump them together in a single category.
One more point to be absolutely clear on. Renewable does not equate to impact free. Solar farms take up land, wind farms alter the landscape and can have an impact on birds and bats, hydropower changes the river and biomass is dependent on how it’s harvested. The manufacturing of the panels and the batteries uses energy and materials, and there is a need for a disposal/recycling plan. Renewables generally don’t emit combustion emissions continuously during operation. The proper comparison is therefore between full life cycles rather than a clean running plant against a dirty one. Life cycle studies are precisely why they are carried out, and they will typically give a range rather than a single figure.
Main Types of Renewable Energy: Solar, Wind, Hydro, Geothermal and More
Six source families cover pretty much everything you’re likely to come across in your coursework. Each one deals with a different physical flow, and each has its own characteristic constraint. The table below gives one mechanism, one concrete fact and one limitation per family. The following sections add a mechanism sentence and a link to the corresponding detailed spoke article. You should compare the rows rather than try to memorise each one individually, as it’s the contrasts that exam questions and project designs are going to be based on.

| Source | How it makes energy | One fact | One limit |
| Solar | Photons excite electrons in a semiconductor, producing direct current | Solar PV capacity reached about 1,866 GW globally by the end of 2024 | Output falls at night and in cloud; needs storage or backup |
| Wind | Moving air turns blades, driving a generator by electromagnetic induction | Power scales with the cube of wind speed | Wind is variable and sites are location-specific |
| Hydropower | Falling or flowing water spins a turbine coupled to a generator | Pumped storage is the largest form of grid storage in use | Dams alter rivers and depend on rainfall and geography |
| Geothermal | Earth’s heat produces steam or hot brine that drives a turbine | Global installed capacity reached about 15.4 GW by end-2024 | Good resources are concentrated in specific geological regions |
| Biomass | Combustion or digestion releases chemical energy stored by plants | Biomass can be stored and dispatched on demand | Sustainability depends on harvest and regrowth rates |
| Ocean and tidal | Tidal range, tidal currents, waves, or thermal gradients drive turbines | Predictable tidal cycles allow output forecasting years ahead | Most ocean technologies remain pre-commercial |
Renewable Energy: Solar Energy for Students
A solar photovoltaic cell works by absorbing the photons and freeing the electrons across a semiconductor junction to produce direct current, which is then fed through an inverter to produce the alternating current that we use in buildings and on the grid. That’s the whole mechanism in one sentence; the rest is just engineering around it. Panels are rated under standard test conditions, so the actual output will be dependent on irradiance, temperature, shading and angle. Higher temperatures actually reduce the efficiency of silicon cells, which is something that a lot of students are surprised by. Temperature derating is the reason why a hot roof on a sunny day can underperform a cool roof. Concentrated solar power works on a completely different principle, using mirrors to create heat, which is then used to generate steam for a turbine.
Solar has become the dominant source of new renewable capacity globally and is by far the easiest one for school projects. You can do real experiments on angle, shading and output with nothing more than a small panel, a multimeter and a lamp.
Renewable Energy: Wind Energy for Students
Wind turbines capture the kinetic energy in the wind and convert it to electricity. The wind turns the blades; the rotor spins a shaft, and a generator then converts that rotation into current via electromagnetic induction. Power goes up with the cube of the wind speed, so a small change in wind makes a massive difference. Doubling the wind speed results in around eight times the power. Siting is absolutely paramount in wind, and a good site is often worth more than a better turbine. Modern turbines also have pitch and rotational speed controls to protect the machinery in high winds. Siting is everything in wind, and a good site can be worth more than a better turbine. There are also environmental costs associated with wind (noise, visual impact, bird and bat impact) which are well documented, and land take increases with capacity (Olabi et al., 2023).
Wind is a useful complement to solar. Solar output peaks at midday, whereas wind tends to blow at night and in winter. A hybrid system can therefore provide a more consistent output than either source on its own (a point which is picked up again in the benefits and challenges section).
Renewable Energy: Hydropower for Students
Hydropower works by converting the potential energy of water into electricity. Water flows down a penstock, turns a turbine and that in turn drives a generator. It’s a very old and proven technology and, as such, is by far the largest single source of renewable electricity generation in the world. Pumped storage provides a second function. When demand is low, you use the cheap or surplus electricity to pump the water up again. When demand is high, you then release the water to go back down through the turbines. One review cites pumped storage efficiency as being in the region of 70-85% and notes its importance in the mix with wind and solar (Amir et al., 2023). The same equipment can be used for both storage and generation, so it’s a very flexible technology.
River systems, fish passage, sediment transport and displacement are all real issues, so new projects will be subject to a rigorous review process.
Renewable Energy: Geothermal Energy for Students
Geothermal plants generate electricity by harnessing the heat from within the Earth. Hot water or steam is drawn from a well; this drives the turbine, and the fluid is typically re-injected back into the reservoir. There are different plant types (dry steam, flash and binary) which are suited to different temperature ranges, with the binary type being the one that can make use of lower temperature resources by boiling a secondary working fluid. The fact that the heat source is down below rather than being weather dependent is what gives geothermal its baseload characteristics. That is its principal advantage and is what sets it apart from solar and wind.
Global installed geothermal capacity was around 15.4GW by the end of 2024 (up from c.13.0GW in 2020; IRENA, 2025). In the US, installed nameplate capacity reached 3,969MWe across 99 plants in 2024 (up from 3,673MWe in 2020 (US DOE, 2025)). Those are capacity figures, not generation. For plant design and conversion efficiency, see geothermal power plant technology.
Regarding the data: the 15.4 GW global figure is IRENA’s end-2024 estimate (published in 2025) and is purely installed electrical capacity. The 3,969 MWe US figure is nameplate capacity from the 2025 US Geothermal Market Report and covers the 99 plants in operation in 2024. Nameplate capacity is a maximum rating under design conditions, and annual generation in TWh will be lower, depending on the capacity factor.
Also Read: What is Environmental Toxicology and Why Does it Matter
Renewable Energy: Biomass Energy for Students
Biomass converts the chemical energy stored in plants into usable energy. You can burn it to produce heat and steam for a turbine, or you can use anaerobic digestion to produce biogas, which can then be used to run an engine or generator. The carbon released in the combustion process was originally absorbed during the growth of the plant, and so it’s often described as being part of a short carbon cycle. That accounting only works if the regrowth is as fast as the harvest. Feedstock sustainability is thus the key issue rather than a nice-to-have. Residues, waste streams and purpose-grown crops all have very different implications in terms of land, water and food.
Biomass has one practical advantage that the other variable sources don’t have, which is that it can be stored and used when you want to. That makes it useful as a form of firm capacity and also for industries which need both heat and power.
Renewable Energy: Ocean and Tidal Energy for Students
Ocean energy takes the form of capturing the motion or temperature difference in seawater. You have tidal barrages and tidal stream turbines, which harness the predictable rise and fall of the tides; wave devices, which capture the surface motion of the waves; and ocean thermal energy conversion, which exploits the temperature difference between the warm surface water and the cold water down at depth. The tides can be predicted years in advance, which is a genuine operational advantage over wind and solar. Predictability is the technology’s key selling point. The problems remain with cost, corrosion and marine ecology, and there are very few installations.
A 2021 review pointed out that all forms of ocean power other than tidal barrages had not yet been commercialised at the time of writing (Jafarinejad et al., 2021). That is a statement based on the state of the art in 2021 and should be treated as such. Ocean energy is an area of active research with a very small number of demonstration projects rather than a mature technology on a par with solar and wind.
How Does Renewable Electricity Reach Homes and Schools?
Generation is of course just the first step. The electricity has to be moved, balanced and delivered, and that is the grid. The grid is a network of generators, transformers, transmission lines, distribution lines and control systems which match supply to demand second by second. Electricity is very difficult to store at grid scale, so supply and demand have to be almost perfectly balanced. Balance is the fundamental problem in power engineering, and that’s why forecasting, storage and flexible generation are all so important. A solar farm that produces nothing at night is not a failure; it’s just a zero output schedule which the rest of the system has to cope with.

Energy source → Conversion (via panel or turbine) → Generation → Transmission (via high voltage lines) → Storage (where required) → Distribution (via local lines) → Home or school
Capacity vs Generation: Why the Difference Matters
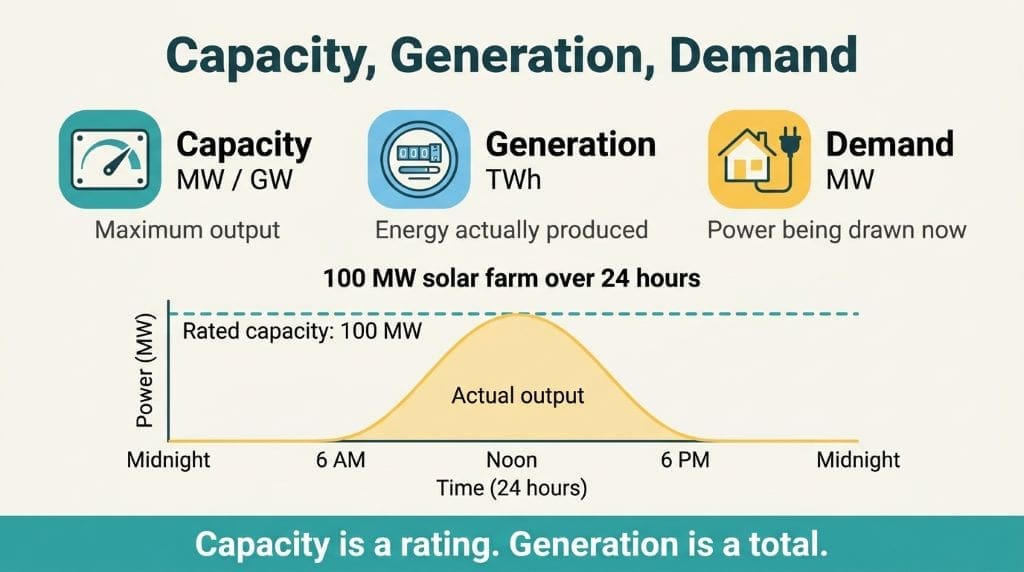
Two figures keep the picture straight. Capacity is the maximum output the plant is capable of (in MW or GW). Generation is the actual amount of electricity produced over a period of time (in TWh). Demand is the amount of power being drawn by the consumer at any one time (in MW). A 100MW solar farm won’t produce 100MW all the time, as there is no output at night and output is reduced by cloud cover. Its annual generation is a function of its capacity factor (the ratio of actual output to maximum possible output). Capacity is a rating. Generation is a total. That’s why you get so much of the nonsense that students see online when the two are conflated.
Modern grids are intelligent grids with intelligence built on top of the physical layer. You’ve got sensors, communications and forecasting models which allow the operator to forecast output and make adjustments in advance. A review of 89 studies on intelligent integration techniques found that machine learning, neural networks and optimisation techniques are all widely used for forecasting solar irradiance and wind speed, with accuracy being reported in terms of standard error metrics (RMSE, MAPE, etc.) (Islam & Roy, 2023). These are all techniques which improve scheduling; they don’t change the physics. They can’t make the wind blow. Forecasting is all about buying time, and that’s exactly what the grid operator needs to keep supply and demand in balance.
Benefits and Challenges of Renewable Energy for Students
Benefits are most obvious at the system level, where a number of benefits compound. The cost of solar and wind has come down dramatically over the last 10 years; fuel is free once the plant is built, and the majority of the technologies have near-zero operating emissions. Energy security is improved by generating your own power from your own sun and wind rather than relying on imported fuel. Local air quality is improved as combustion goes down. The jobs move to installation, maintenance and grid work, which are all local jobs. A number of benefits tend to come together so that the policy support has been very broad across a range of different economies.

These benefits are what have driven the rate of adoption. Solar and wind now account for the vast majority of new capacity being added globally, and some 800GW of renewable capacity was added in 2025 alone (IEA 2026a). Cost is no longer the primary constraint in most markets, although financing and grid connection are still the deciding factors as to which projects get through. In essence, the debate has moved from can renewables compete to how fast can the system absorb them.
Key Challenges: Managing Variability with Hybrids and Storage
Students face challenges in renewable energy are all to do with variability, storage, land, materials and integration. Sun and wind come when nature dictates rather than on demand, so you have to balance that output via storage, flexible generation, demand response or interconnection over a wide area. Hybrids can be of help as solar and wind tend to peak at different times. One review of hybrid renewable systems notes that combining PV and wind with storage can lead to a reduction in intermittency, improved grid stability and lower cost through shared infrastructure (Hassan et al., 2023). It’s not a panacea, though. It will reduce the variability rather than eliminate it, and it will add to the level of control complexity.

A 2021 review made the same point from the workforce perspective. It pointed out that in a hybrid system, you can use solar to make up for the periods when wind is poor and vice versa. HOMER and SAM are the tools used to size and test those combinations prior to construction (Jafarinejad et al., 2021). That’s now the norm in the way projects are developed, and that’s one of the reasons that employers are looking for people who have modelling skills as well as theory. You save on capital by designing before you build, and you turn the intermittency issue into a sizing and scheduling issue, which the software can help you with. The physics underneath is the same; the engineering response is different.
Storage is at the heart of most of these issues. Pumped hydro is by far the dominant form of large-scale storage at the moment, with reported efficiencies in the 70-85% range and, of course, a geographical constraint on where you can put the sites. Batteries are fast (respond in milliseconds) and are well suited to daily cycling; flow batteries and thermal storage fill other roles (Amir et al., 2023; Panda et al., 2023). There is no one technology that can do it all, so it’s really a portfolio approach to storage rather than a single technology.
Research in focus
Claim supported: storage is a portfolio of technologies, and the barriers to renewable deployment are as institutional as they are technical.
Amir et al. (2023) do a survey of storage in all the major categories (electrochemical, mechanical, electromagnetic, thermodynamic, chemical and hybrid). They look at performance, safety, cost and environmental impact, propose an optimal scheduling framework and discuss policy for sustainable deployment. The comparisons are based on a synthesis of numerous primary studies, so the efficiency and cost figures should be treated as ranges rather than single verified values.
The barriers follow a similar pattern of persistence. A review of renewable energy systems groups them as economic and financial, technical, social and environmental, regulatory and policy, and institutional and administrative, and notes that several still exist in many countries (Olabi et al., 2023). Barriers are often institutional as much as technical, which is why the same technology can move quickly in one market and stall completely in another.
What Is Settled and What Is Still Open
It helps to separate settled facts from open research questions. The settled facts are that the cost of solar and wind has dropped dramatically and that storage can shift power across the day. The open questions are the cheapest way to handle the seasonal mismatch, the best routes for blade and panel recycling, and how much transmission a high-renewable grid will need.
Research activity tracks that mix. A scoping review of 92,873 Scopus papers from 2020 to 2021 found perovskite solar cells to be the most prominent topic, with clusters around batteries, nanostructured materials, organic photovoltaics and computer science methods (Kolosok et al., 2021). That measures attention, not maturity. Perovskite cells are a very active research area, but they are not yet a mature commercial product at scale.
Regarding this data: the 92,873 publication sample covers 2020-2021 across 123 Scopus sources and is a measure of publication activity, not of technology performance, cost or deployment. It should not be taken as evidence that any technology is commercially ready.
How Can Students Explore Renewable Energy? Projects, Careers, and NYC STEM
The quickest way to get your head around this is to build something small and measure it. A solar panel, a multimeter and a lamp will give you real data in an hour. You can vary the angle, test shading and plot output against time. The same principle applies to a model turbine in a wind tunnel, a thermos flask as a stand-in for thermal storage or a spreadsheet model of the school’s electricity use. Measurement is far better than description as it forces you to deal with units, error and variability. None of this requires any expensive kit and all of it is directly relevant to the physics and maths that you’re already teaching.
Renewable Energy Projects for Students
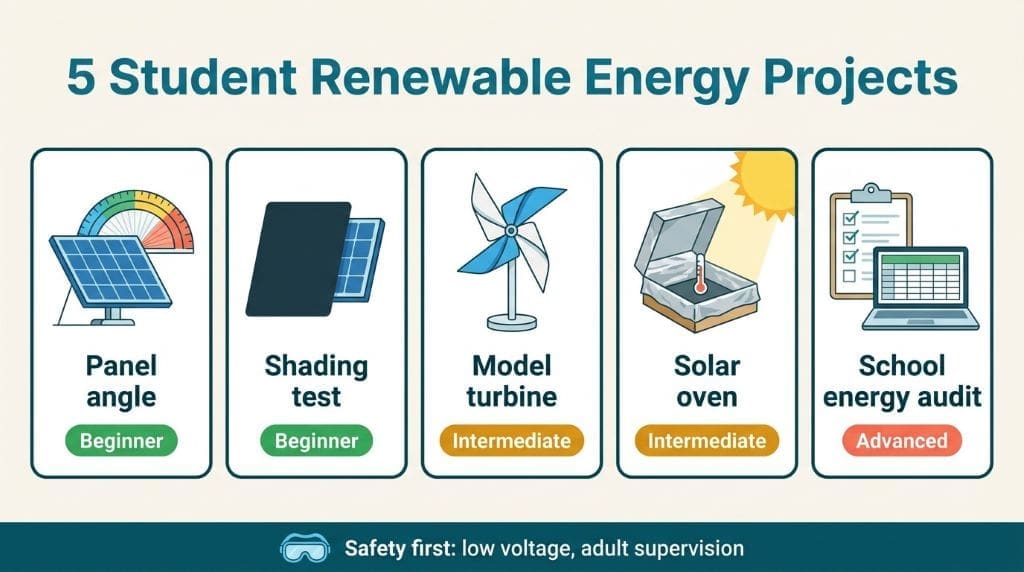
Here are five starting points (each with a difficulty level and a safety note). These are just previews really; the full set of 25 projects (with full materials list and worksheets) is on the projects page.
Teachers will often ask whether the effort is worth it. The research suggests it can be, with some important qualifications. The 2026 systematic review found that project-based, inquiry and engineering design approaches were frequently cited as leading to improvements in both understanding and engagement, though it did point out that the majority of the study designs were non-randomised (Oviedo Díaz et al., 2026). A separate review of interventions in secondary schools found that structured activities could have a positive impact, although there remained a significant gap in terms of teacher training and resources (Hoque et al., 2022). Take those findings as encouraging rather than definitive and be prepared for variation from one classroom to the next.
Digital Tools and Simulators for Students in Renewable Energy Learning
Digital tools provide a second route, particularly where hardware is not readily available. Free simulators allow students to model a system, vary the inputs and observe the outcomes without the need to purchase any hardware. A study of a MATLAB-based graphical interface used by 54 STEM undergraduate students in a renewable energy course at a Malaysian university found that 90.8% of the respondents were satisfied with the tool and that it did indeed make the calculation-intensive work much simpler. Importantly, the students reported that their perception of the difficulty of the subject itself did not change (Gopabala Krishnan et al., 2023). That’s a crucial distinction to make: you can reduce the friction of doing the work without in any way making the subject any easier. The study was of one course at one university, and the data was self-reported via a survey. It tells us nothing at all about the 8-12 age group.
Research in focus
Claim supported: the purpose-built simulator was well received and did indeed make the calculations easier for the students without in any way altering the perceived difficulty.
Gopabala Krishnan et al. (2023) surveyed 54 STEM students taking a renewable energy course at Universiti Malaysia Terengganu. They used paired t-tests and Wilcoxon signed-rank tests. The Energy Computator GUI was used to perform the formulae, generate the graphs, do the unit conversions and derive the parameters. Limitations were: single institution, small sample size, self-reported data, no control group and no measurement of learning gains.
Renewable Energy Careers for Students
Careers in the sector split into a number of tracks, and students don’t have to specialise at an early stage. You can have an engineering role (designing systems, running simulations, managing grid connections), a technician role (installing, commissioning and maintaining equipment), a project development role (land, permits and finance), a policy/analysis role (markets and regulation) or a software/data role (building the forecasting and monitoring tools that the grid is increasingly reliant on). A 2021 review of workforce needs found that employers were struggling to find the right skilled people and that engineering roles in particular were going to require a BSc with a very strong grounding in analysis and simulation (Jafarinejad et al., 2021). Breadth of skills is an advantage as the sector is very much one that will hire across disciplines.

Be very careful with job numbers as they go out of date very quickly. The same review cited 11.46 million renewable energy jobs globally in 2019 (based on IRENA data), with solar PV, bioenergy, hydropower and wind being the biggest employers (Jafarinejad et al., 2021). Those are 2019 numbers and should not be quoted as current. For current numbers, you need to use the most recent IRENA annual jobs review and check the year of publication. Always attach a year to a job figure. A number without a date is misinformation within a year or two, even if it was accurate when it was first published.
Your Renewable Energy Learning Pathway for Students
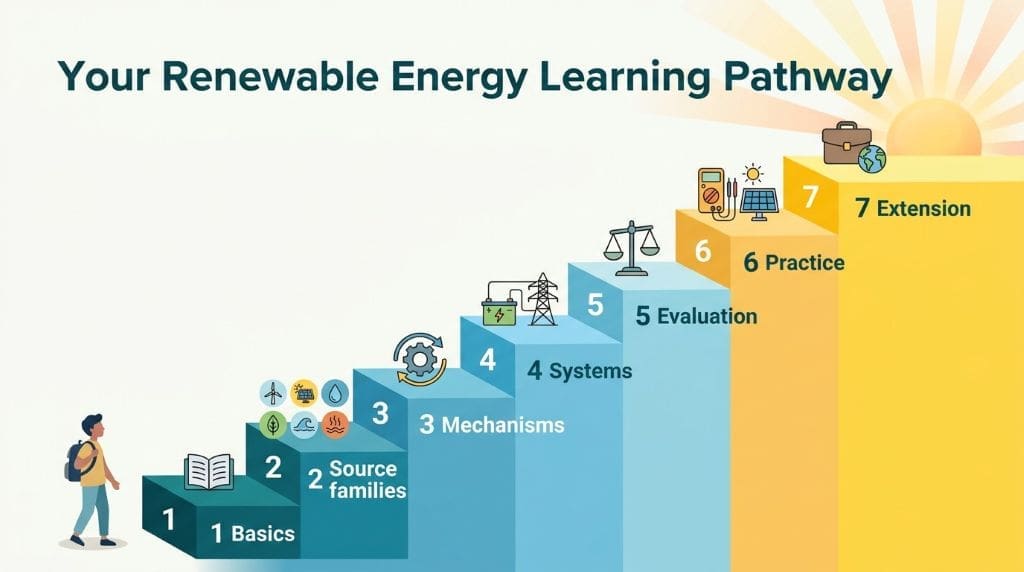
A pathway is better than a reading list because it’s a sequence of ideas. Students can start with the fundamentals of what renewable energy is and why the timescale test is so important. Then go on to the six source families. From there, you look at how one of those sources actually turns its flow into electricity. Once you’ve got the mechanisms clear, you can add in storage and grids (that’s where the variability becomes an engineering problem rather than just a complaint). Then you can look at the benefits and the challenges together. Projects come next, as that’s where you start to test your assumptions. Finally, you can move on to careers, policy and the future. Each stage builds on the one before, so you simply won’t get to the depth of understanding you need if you skip straight to policy.
Browse the full cluster at Renewable Energy, and connect the energy story to wider climate questions at Climate Change.
How This Guide Was Compiled
This article was written from peer-reviewed open-access literature and primary institutional data. Ten research papers formed the core evidence base, each read in full and placed where its findings actually apply. Education claims rest on two systematic reviews, both of which explicitly caution against causal interpretation. Technology claims rest on reviews of storage, hybrid systems, intelligent integration, and renewable resource comparisons. Workforce claims come from a 2021 review and are dated wherever cited. Current deployment figures were checked against IEA, IRENA, and US Department of Energy primary pages, and each statistic carries a note naming its source, year, and scope. Claims that could not be verified were omitted rather than estimated, and contested points are marked as open questions. No figure was carried over from a secondary summary when a primary source was available.
Verified Resources
These organisations publish the primary data and definitions used above. Each link points to a live institutional page rather than a reprint.
- IEA — Global Energy Review 2026
- IEA — Electricity 2026
- IRENA — Geothermal energy
- IRENA — Renewable capacity highlights 2025
- US Department of Energy — Geothermal market report
- US DOE — Office of Energy Efficiency and Renewable Energy
- US EIA — Annual Energy Outlook
- NREL — System Advisor Model (SAM)
- MNRE — Physical progress (India)
- Central Electricity Authority (India)
- UN — Sustainable Development Goal 7
Frequently Asked Questions About Renewable Energy for Students
Renewable energy comes from sources that natural processes continually replenish, such as sunlight, wind, flowing water, geothermal heat, and plant material. These sources are not used up the way coal or oil is burnt. The key test is timescale: if replenishment happens within a human lifetime, the source is renewable.
The six main families are solar, wind, hydropower, geothermal, biomass, and ocean or tidal energy. Solar and wind dominate new capacity additions worldwide. Hydropower produces the most renewable electricity. Geothermal provides steady baseload output. Biomass is storable, and ocean technologies remain largely at the demonstration stage.
Renewable sources refill through natural processes within years or decades. Nonrenewable sources such as coal, oil, gas, and uranium exist in finite stocks formed over millions of years. The difference affects pricing, plant lifetime, and emissions. It does not, by itself, tell you which option has the lower environmental impact.
No. Nuclear fission uses uranium, a finite mined fuel, so it is not renewable. It is low-carbon during operation and provides steady output, which is why the IEA and US DOE discuss it within clean or low-emissions energy. Two separate questions are involved: whether fuel replenishes, and whether generation emits.
Advantages include near-zero operating emissions, free fuel, energy security, public health gains, modular construction, and local jobs. Disadvantages include variable output, storage costs, land use, grid connection delays, material supply concerns, and end-of-life recycling challenges. Most projects involve trade-offs across several of these at once.
Photovoltaic cells absorb photons and release electrons across a semiconductor junction, producing direct current. An inverter converts that to alternating current for buildings and grids. Output depends on irradiance, temperature, shading, and panel angle. Higher cell temperatures reduce efficiency, so cool sunny conditions can outperform hot ones.
Pumped hydro stores the most energy globally, pumping water uphill when power is cheap and releasing it through turbines at peak demand. Lithium-ion batteries suit hours of shifting and fast response. Flow batteries, compressed air, flywheels, and thermal storage serve narrower roles. No single technology covers every duration.
Beginners can test panel angle and shading with a small module and multimeter. Intermediate projects include model wind turbines and solar water heaters. Advanced students can audit school electricity use and model a solar-plus-storage offset in a spreadsheet. Low-voltage equipment and adult supervision keep every project safe.
Engineers design systems and run simulations. Technicians install and maintain equipment. Developers handle land, permits, and finance. Analysts work on policy and markets. Software specialists build forecasting and monitoring tools. Most engineering roles require a bachelor’s degree, while technician roles often favour technical training and certification.
Start with the fundamentals, then study one source mechanism in depth. Add measurement through a small project, because data exposes assumptions quickly. Free simulators such as NREL’s System Advisor Model allow system modelling without hardware. Structured programs with mentoring add feedback that self-study rarely provides.
Individual solar or wind plants vary with weather, so their output is not constant. Reliability comes from the system: storage, flexible generation, demand response, forecasting, and interconnection over wide areas. Grids with high renewable shares manage this daily, though integration requires planning and investment in transmission.
Capacity is a plant’s maximum rated output, measured in MW or GW. Generation is the energy actually produced over time, measured in TWh. A 100 MW solar farm does not produce 100 MW at night. Annual generation depends on capacity factor, so capacity figures always overstate energy output.
References
- Amir, M., Deshmukh, R. G., Khalid, H. M., Said, Z., Raza, A., Muyeen, S. M., Nizami, A.-S., Madurai Elavarasan, R., Saidur, R., & Sopian, K. (2023). Energy storage technologies: An integrated survey of developments, global economical/environmental effects, optimal scheduling model, and sustainable adaptation policies. Journal of Energy Storage, 72, Article 108694. https://doi.org/10.1016/j.est.2023.108694
- Gopabala Krishnan, L., Albani, A., Segar, Y., Ridzuan, A. R., Ismail, M. K., Musa, M. A., Gunaseelan, K., Subramaniam, T. S., & Ibrahim, M. Z. (2023). The student response to the use of a renewable energy graphical interface simulator in a learning environment. Frontiers in Education, 8, Article 1023499. https://doi.org/10.3389/feduc.2023.1023499
- Hassan, Q., Algburi, S., Sameen, A. Z., Salman, H. M., & Jaszczur, M. (2023). A review of hybrid renewable energy systems: Solar and wind-powered solutions: Challenges, opportunities, and policy implications. Results in Engineering, 20, Article 101621. https://doi.org/10.1016/j.rineng.2023.101621
- Hoque, F., Yasin, R. M., & Sopian, K. (2022). Revisiting education for sustainable development: Methods to inspire secondary school students toward renewable energy. Sustainability, 14, Article 8296. https://doi.org/10.3390/su14148296
- International Energy Agency. (2026a). Global energy review 2026. https://www.iea.org/reports/global-energy-review-2026
- International Energy Agency. (2026b). Electricity 2026. https://www.iea.org/reports/electricity-2026
- International Renewable Energy Agency. (2025). Geothermal energy. https://www.irena.org/Energy-Transition/Technology/Geothermal-energy
- Islam, S., & Roy, N. K. (2023). Renewables integration into power systems through intelligent techniques: Implementation procedures, key features, and performance evaluation. Energy Reports, 9, 6063–6087. https://doi.org/10.1016/j.egyr.2023.05.063
- Jafarinejad, S., Beckingham, L. E., Kathe, M., & Henderson, K. (2021). The renewable energy (RE) industry workforce needs: RE simulation and analysis tools teaching as an effective way to enhance undergraduate engineering students’ learning. Sustainability, 13, Article 11727. https://doi.org/10.3390/su132111727
- Kolosok, S., Bilan, Y., Vasylieva, T., Wojciechowski, A., & Morawski, M. (2021). A scoping review of renewable energy, sustainability and the environment. Energies, 14, Article 4490. https://doi.org/10.3390/en14154490
- Olabi, A. G., Elsaid, K., Obaideen, K., Abdelkareem, M. A., Rezk, H., Wilberforce, T., Maghrabie, H. M., & Sayed, E. T. (2023). Renewable energy systems: Comparisons, challenges and barriers, sustainability indicators, and the contribution to UN sustainable development goals. International Journal of Thermofluids, 20, Article 100498. https://doi.org/10.1016/j.ijft.2023.100498
- Oviedo Díaz, S. M., Jiménez Sierra, Á. A., & Bayona Velásquez, E. M. (2026). Integrating energy education through STEM/STEAM: Conceptual and pedagogical foundations from a systematic review. Sustainability, 18, Article 10024. https://doi.org/10.3390/su181910024
- Panda, A., Dauda, A. K., Chua, H., Tan, R. R., & Aviso, K. B. (2023). Recent advances in the integration of renewable energy sources and storage facilities with hybrid power systems. Cleaner Engineering and Technology, 12, Article 100598. https://doi.org/10.1016/j.clet.2023.100598
- U.S. Department of Energy. (2025). 2025 U.S. geothermal market report. https://www.energy.gov/hgeo/geothermal/market-report
