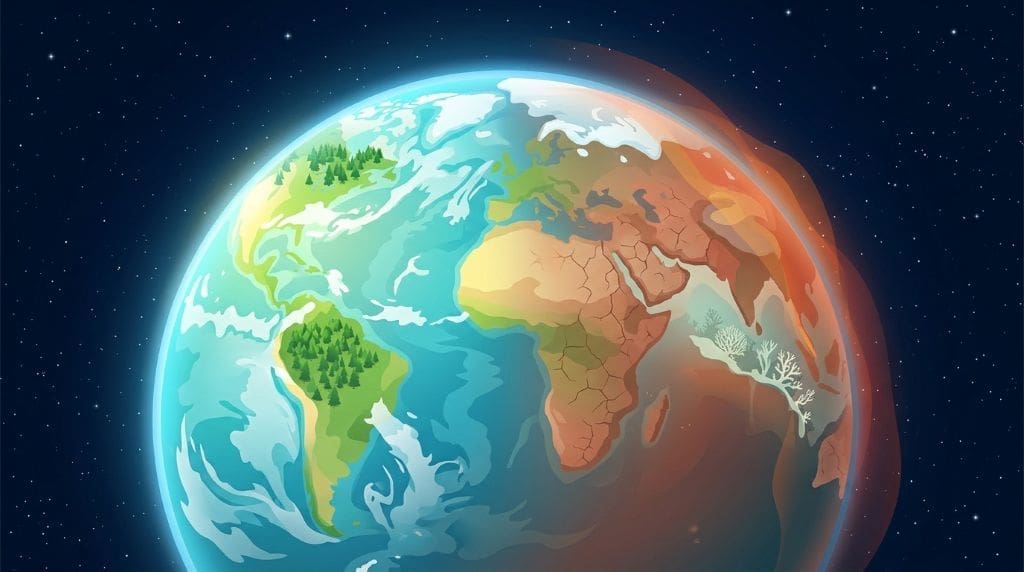

A person’s daily choices produce greenhouse gases, and their carbon footprint measures these emissions. These choices include how they travel, heat their home, use electricity, eat, and shop. Students can measure their carbon footprint in tons of CO₂-equivalent per year, and a free calculator can help them work out their own figure in about ten minutes.
An individual’s environmental footprint comes from four factors. First, transportation covers buses, trains, cars, bikes, and planes. Second, home energy includes heating, cooling, lighting, and appliances, even in dorm rooms. Food depends on what people eat, with meat and dairy producing more emissions than grains, beans, and vegetables. Finally, consumption and waste cover clothes, phones, packaging, and other items people throw away.

The scale is real: Hertwich and Peters found that household consumption accounts for about 72% of global greenhouse gas emissions, with 20% from food, 19% from residential operation and maintenance, and 17% from mobility (Hertwich & Peters, 2009). The study examined 73 countries across 14 world regions. Likewise, Dubois and his team identified a similar pattern among households in Europe. Furthermore, he found that car and air travel, meat and dairy, and heating are the main contributors to their environmental footprints (Dubois et al., 2019). Yet, your personal footprint is only one part of a much larger system. Universities and schools also have their own footprints. Review studies show an average of 2.67 tCO₂e per student, ranging from 0.06 to 10.94 (Valls-Val & Bovea, 2021).
Carbon Footprint Calculators for Students
To use a carbon footprint calculator, students need to provide several inputs. The tool also estimates the emissions connected to those inputs. The carbon footprint calculator calculates a total by multiplying each activity by an emission factor, resulting in a figure expressed in tons of CO₂-equivalent per year. The process usually takes 10 to 15 minutes.

Instead, use a reputable tool rather than an anonymous widget. Researchers have documented the University of California, Berkeley, CoolClimate Calculator well and used it in peer-reviewed research. The EPA Household Carbon Footprint Calculator for students is also a solid option for U.S. households.
Tracking Change in Carbon Footprints Over Time
These tools can track changes in carbon footprints over time. Cordero, Centeno, and Todd studied 104 graduates of a one-year climate course at least five years after it ended. Participants reported cutting their carbon output by an average of 3.54 tons per year, or 2.86 tons more than the average California resident (Cordero et al., 2020). The researchers used the CoolClimate Calculator to estimate emissions from reported actions. For example, one participant reduced emissions by 1.38 tons per year by purchasing renewable energy. However, these results apply only to the people who took the course. Similarly, a Toronto study of engineering students found a weak link between carbon literacy and smaller footprints, suggesting that knowledge alone rarely leads to action (Ram et al., 2023).
Why Carbon Footprint Calculators Give Estimates, Not Audits
This is because results depend on the data users enter and the emission factors each tool applies. Moreover, a review of 35 campus carbon footprint studies found considerable differences in measurement methods, data, and emission factors, making comparisons difficult (Valls-Val & Bovea, 2021).
Does Using a Carbon Footprint Calculator Lower Student Emissions?
Students at Konstanz previously calculated their footprints, which averaged 9.8 tons of CO₂e, compared with 11.1 tons among those who had not. Nevertheless, researchers noted that more environmentally conscious students might be more likely to calculate their footprints (Sippel et al., 2018). Similarly, climate knowledge also matters. Stronger climate knowledge was associated with lower footprints, about 1 ton of CO₂e lower per year, due to reduced transport emissions (Fizaine & Le Borgne, 2025).
10 Actionable Strategies for Students to Cut Carbon Footprints
You don’t need to make all the changes at once, since research has identified four areas. The four areas are transportation, the energy you use at home, the food you eat, and the products you buy and discard. Overall, the measures mentioned below have been adapted to suit student life. For each measure, the typical impact is given where a study has supplied this information. To conclude, start with the area where your emissions are highest.

Cut Emissions From Getting Around
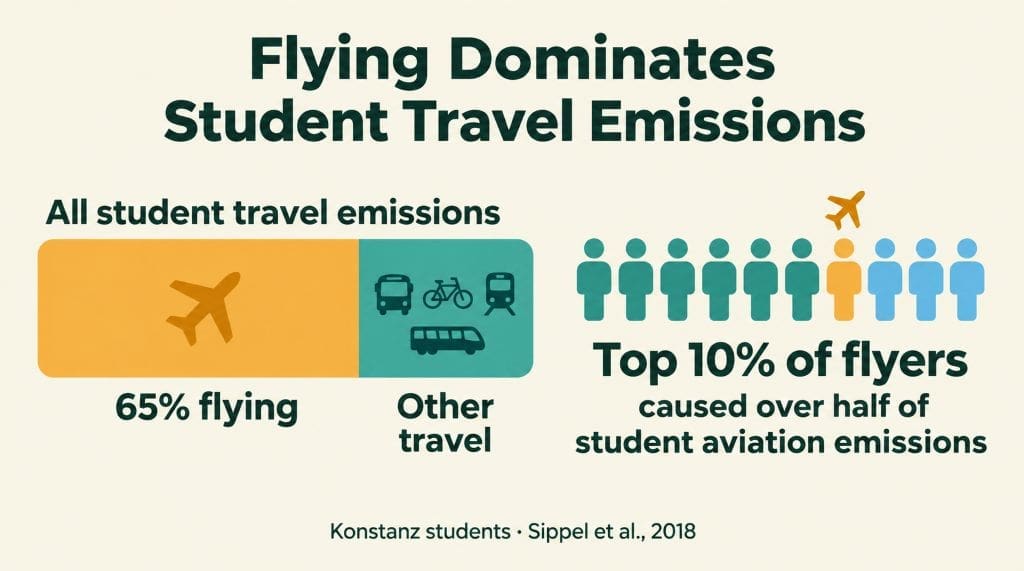
Transport is the best place to start. Buses, trains, bikes, and walking beat driving for most trips, and in the Cordero study, transportation changes delivered 40% of all measured emission reductions (Cordero et al., 2020). Globally, mobility carries about 17% of consumption-linked emissions (Hertwich & Peters, 2009), and in 63 of 116 countries, cutting car use offered the largest mobility-related savings (Guan et al., 2025). Flying, however, deserves its own decision rather than being a habit. Among Konstanz students, aviation made up 65% of mobility emissions, and the 10% who flew most caused over half of all student aviation emissions (Sippel et al., 2018). Similarly, Guan and colleagues found that “Less Flying” was the top mobility measure for 20 countries (Guan et al., 2025).
Reduce Your Home Energy Use
Heating is one of the three dominant household emission sources in Europe (Dubois et al., 2019), so running your room cooler matters. Buildings-related lifestyle shifts contributed 6.1% of modelled global reductions (Guan et al., 2025), and small thermostat tweaks and closing windows in winter cost nothing. Next, switch to cleaner electricity where you can. Buying renewable power cut 1.38 tons per year for one study participant (Cordero et al., 2020). However, knowledge alone showed no clear effect on housing emissions (Fizaine & Le Borgne, 2025), so pair awareness with practical switches. Finally, upgrade efficiency when the chance appears. Passive house standards can sharply cut residential energy use (Guan et al., 2025), and for students, that usually means an efficient appliance or a well-insulated room.
Shift What and How You Eat
Meat and dairy are leading footprint components for households (Dubois et al., 2019). A healthy vegan diet could cut regional emissions by 17.4% in Latin America and the Caribbean (Guan et al., 2025), and food choices accounted for 13% of reductions in the Cordero study (Cordero et al., 2020). Switching a few lunches a week to plant-based meals is a real start. Wasting less food matters just as much. Waste reduction was the second-largest category in the Cordero study, at 33% of measured reductions (Cordero et al., 2020). Planning meals and buying only what you will eat is a quiet climate action with immediate payoffs for your budget too.
Buy Less, Repair More, and Recycle Wisely
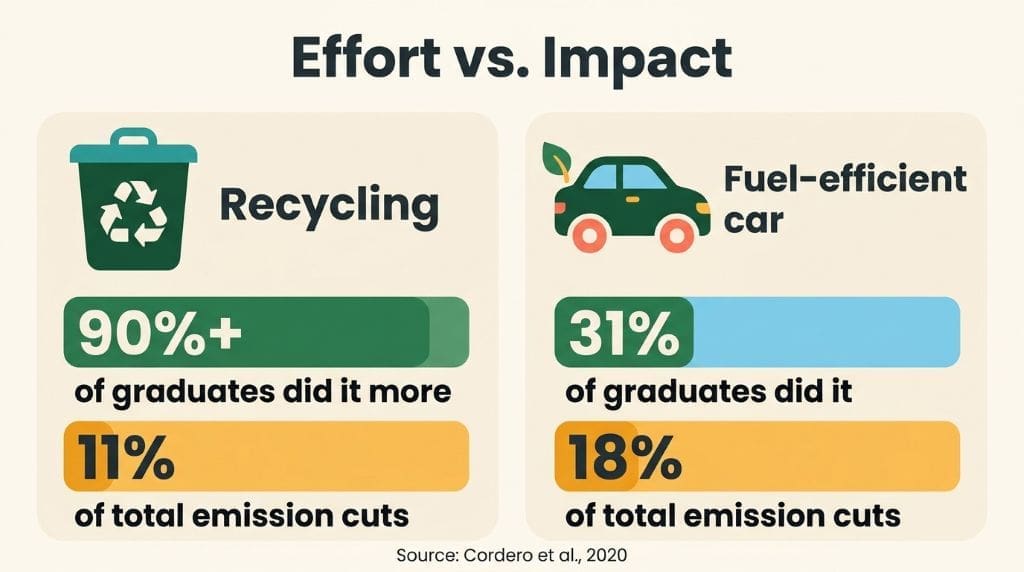
Recycling helps, but it has limits. Over 90% of surveyed graduates recycled more after the course, yet recycling accounted for only 11% of their total emission cuts. By comparison, buying a more fuel-efficient car, reported by just 31% of participants, accounted for 18% (Cordero et al., 2020). Recycle well, but do not count on it alone. Keeping, repairing, and sharing what you own goes further. Extending garment life through swapping and repairing could cut global greenhouse gas emissions by about 1.2% (Guan et al., 2025). Share-and-repair practices for home appliances showed potential in 94 of 116 countries, and manufactured products rise steeply with income (Hertwich & Peters, 2009). Used books, repaired laptops, and clothing swaps all count.
Combine Actions and Watch Your Re-Spending
Stacking actions multiplies the effect. Combined lifestyle changes among high-emitting households could cut 10.4 Gt CO₂e, or 40.1% of household consumption-based emissions across 116 countries (Guan et al., 2025). One caution applies, however: re-spending the money you save can offset 6.5% to 45.8% of those gains. Spend savings on low-carbon options.

Start with one or two actions you can repeat weekly, and track them with a carbon footprint calculator. As a result, you will see whether your choices actually move the number. In contrast to one-off gestures, small habits compound. For the most part, the biggest wins sit in transport and in the largest purchases you make.
School-Wide and Community Climate Projects
The habits we each have matter; schools and clubs reinforce them. A university, for example, can alter common systems—such as transport, cafeterias, and the buildings—since no single student can manage these on their own. The studies reviewed on the university’s carbon footprint show how this happens in practice through policies on commuting, waste reduction, and greener procurement (Valls-Val & Bovea, 2021). Therefore, one should go beyond their own daily routines.
A Year-Long Course Model for Student Climate Projects
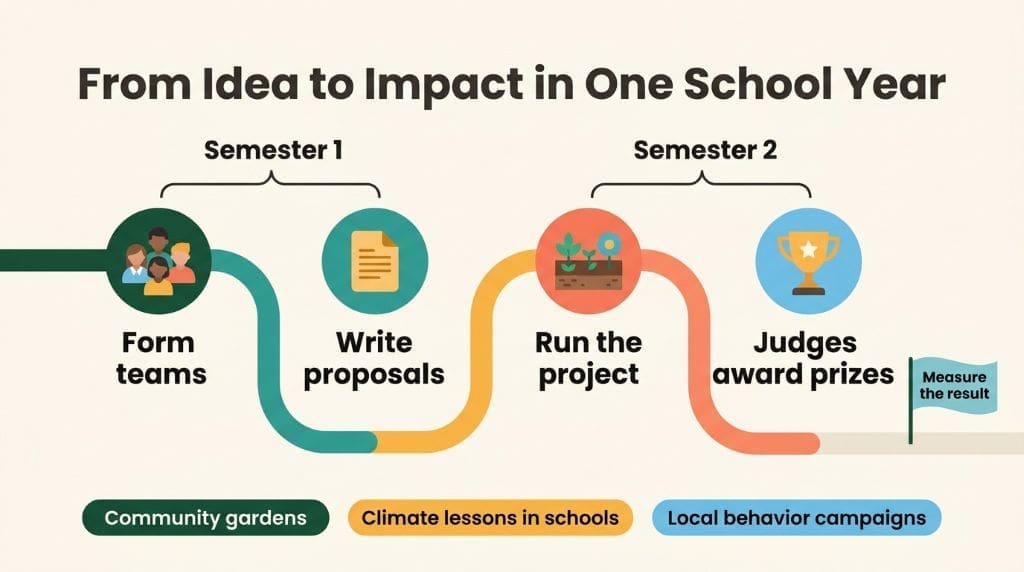
Cordero and his colleagues developed and tested the template during a one-year course. In this course, student teams selected a community and then designed and implemented a real climate project. In the first semester, they formed teams and drafted proposals; in the second semester, they carried out their projects. The projects involved setting up community gardens, giving climate lessons in schools, and organizing local behaviour-change campaigns. Finally, prizes were awarded by external judges from local government and industry (Cordero et al., 2020). You could apply this structure in your classroom or club—for instance, in an NYC STEM class or a school eco-club. The essential elements are a real audience, a semester-long preparation period, and a measurable result.
Four project starters suit student groups (Valls-Val & Bovea, 2021), (Sippel et al. 2018) and (Dubois et al., 2019). :
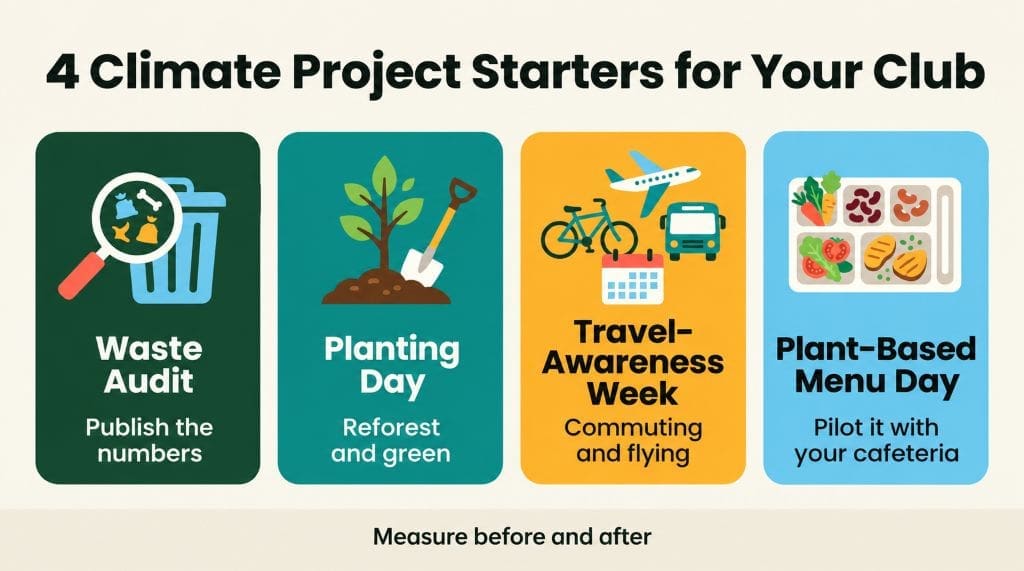
To measure the quantity before and after the event, a project provides figures. For example, the number of kilograms of waste diverted, the number of flights avoided, or the number of meals switched. In this way, it teaches more than any poster could. Moreover, Dubois and his colleagues also warn that household efforts made voluntarily are not enough by themselves to reach deep climate targets. Therefore, it is essential for policy frameworks to support the necessary changes (Dubois et al., 2019). Indeed, student projects also provide an opportunity to ask institutions to alter their practices.
Carbon Offsets Explained Simply
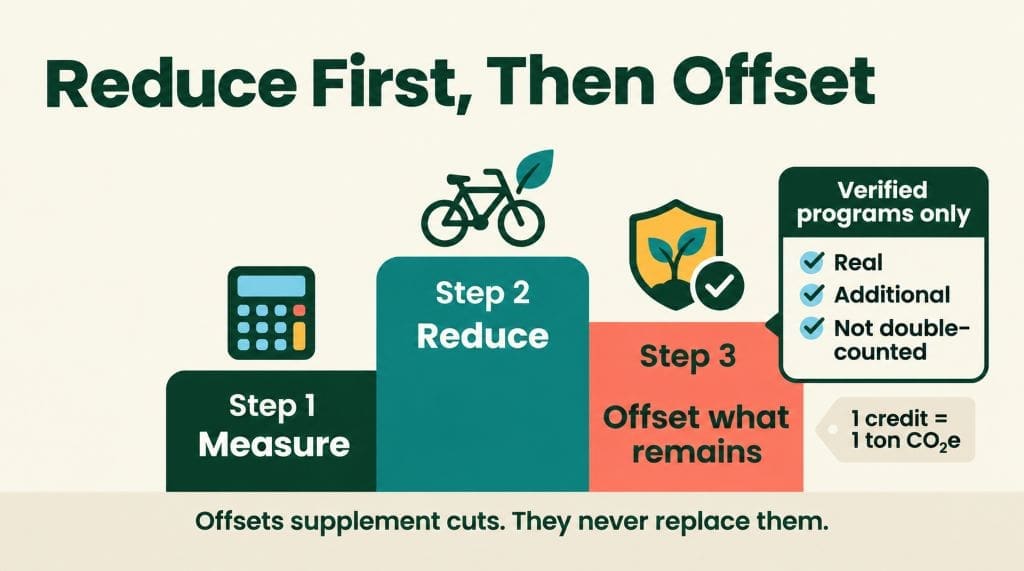
To put simply, a carbon offset is something you pay for in order to compensate for the emissions which you are not able to reduce at this time. A carbon credit is a tradable unit that usually represents one ton of CO₂-equivalent. Different projects, such as reforestation and cleaner energy, generate these credits and sell them through markets or retailers.

Quality differs a great deal, making it necessary to carry out verification. To ensure that the reductions are real, extra, and not double-counted, reliable programmes make use of third-party standards. In the United States, the Federal Trade Commission’s Green Guides have a section dealing with carbon offsets and mandate that marketers support any claims about offsets with competent and reliable evidence. Credits which have not been verified must not be regarded as if they had been verified.
The simple answer is that offsets are an additional measure, not a substitute. In the Cordero study, the participants mostly lowered their emissions by implementing direct changes rather than by purchasing offsets. Moreover, a review of 35 university footprint studies revealed that only 14% of them had carried out any offsetting, and in those instances offsets made up between 0.09% and 18% of the footprint (Valls-Val & Bovea, 2021). You should reduce your emissions first and then offset the rest—only by means of verified programmes. To put it another way, you should buy offsets just as you would buy medicine: on the basis of evidence.
Key Takeaways
Your carbon footprint reflects everyday choices—from travel and home energy to food and consumption. This infographic highlights the biggest-impact decisions, explains how students can measure their footprint, and shows how individual habits can grow into school-wide climate action.

How This Guide Was Compiled
The article relies solely on the eight peer-reviewed sources included in the reference list below, as well as on official .gov and .edu websites. It does not cite any sources that are not listed, and each factual statement is linked to its source. Rather than retaining the two earlier, overlapping articles on this site, the guide has replaced them, and the previous URLs now redirect to this page. When the research refers to a particular group—for example, students at a German university, engineering students in Toronto, or graduates of a single course in California—the findings are attributed to that specific group and are not generalized to all groups.
Verified Resources
- EPA Household Carbon Footprint Calculator.
- EPA Greenhouse Gas Emissions hub.
- NOAA Climate.gov.
- NASA Climate.
- CoolClimate Calculator — University of California, Berkeley.
- Open-access studies: Cordero et al., 2020 (PLOS ONE); Guan et al., 2025 (Nature Communications); Ram et al., 2023 (Heliyon); Dubois et al., 2019 (Energy Research & Social Science); Fizaine & Le Borgne, 2025 (Journal of Environmental Management).
- FTC Green Guides, 16 CFR 260.5 — Carbon offsets.
Frequently Asked Questions About Reducing Your Carbon Footprint
The amount of greenhouse gases resulting from the decisions you take is expressed in terms of CO₂-equivalent, and these emissions come from such sources as transport, the energy used at home, the food you consume, and your general level of consumption. For students, the figure is usually provided on an annual basis, and a carbon footprint calculator can calculate this amount in around ten minutes.
Take it as just a rough estimate, not something that has been thoroughly audited. The degree of accuracy is determined by the data you give and by the emission factors of the tool. As the campus footprint reviews indicate that the methods vary considerably, students should use the same carbon footprint calculator over time and concentrate on the trend rather than the exact figure.
For the average student, it is the method of transport they choose that makes the difference; in the Cordero study, transport was responsible for 40% of the measured reductions, and among the students in Konstanz, aviation was the main source of mobility emissions. Usually, the best effect is achieved by cutting down on flights or using ground transport instead.
The offsets are extra in addition to the arrangement, not an alternative; they have to be supported, and since the FTC requires that offset claims be substantiated, unverified credits cannot take the place of verified ones.
By no means alone. More than 90% of the graduates surveyed recycled more, but recycling accounted for only 11% of the total reductions measured. Although recycling matters, decisions regarding transport, energy, and food have greater impact.
Take the community action project approach by setting up teams, drawing up proposals, and then carrying out a real local project over the span of a semester. Select a specific example that can be measured, for instance, a waste audit or a travel awareness campaign which lasts for a week, and make the results available to the public.
Yes, the carbon footprint calculators work for students living in dorms, provided that you are careful. If you are entering your shared energy costs, then give them as a proportion of the total or as your best estimate; although the estimate is less accurate, it still clearly indicates the direction of your changes over time.
References
- Cordero, E. C., Centeno, D., & Todd, A. M. (2020). The role of climate change education on individual lifetime carbon emissions. PLOS ONE, 15(2), e0206266. https://doi.org/10.1371/journal.pone.0206266
- Dubois, G., Sovacool, B., Aall, C., Nilsson, M., Barbier, C., Herrmann, A., Bruyère, S., Andersson, C., Skold, B., Nadaud, F., Dorner, F., Moberg, K. R., Ceron, J. P., Fischer, H., Amelung, D., Baltruszewicz, M., Fischer, J., Benevise, F., Louis, V. R., & Sauerborn, R. (2019). It starts at home? Climate policies targeting household consumption and behavioral decisions are key to low-carbon futures. Energy Research & Social Science, 52, 144–158. https://doi.org/10.1016/j.erss.2019.02.001
- Fizaine, F., & Le Borgne, G. (2025). Climate knowledge matters: A causal analysis of knowledge and individual carbon emissions. Journal of Environmental Management, 385, 125604. https://doi.org/10.1016/j.jenvman.2025.125604
- Guan, Y., Shan, Y., Hang, Y., Nie, Q., Liu, Y., & Hubacek, K. (2025). Unlocking global carbon reduction potential by embracing low-carbon lifestyles. Nature Communications, 16, 4599. https://doi.org/10.1038/s41467-025-59269-1
- Hertwich, E. G., & Peters, G. P. (2009). Carbon footprint of nations: A global, trade-linked analysis. Environmental Science & Technology, 43(16), 6414–6420. https://doi.org/10.1021/es803496a
- Ram, S. A., MacLean, H. L., Tihanyi, D., Hannah, L., & Posen, I. D. (2023). The complex relationship between carbon literacy and pro-environmental actions among engineering students. Heliyon, 9, e20634. https://doi.org/10.1016/j.heliyon.2023.e20634
- Sippel, M., Meyer, D., & Scholliers, N. (2018). What about greenhouse gas emissions from students? An analysis of lifestyle and carbon footprints at the University of Applied Science in Konstanz, Germany. Carbon Management, 9(2), 201–211. https://doi.org/10.1080/17583004.2018.1440851
- Valls-Val, K., & Bovea, M. D. (2021). Carbon footprint in Higher Education Institutions: A literature review and prospects for future research. Clean Technologies and Environmental Policy, 23, 2523–2542. https://doi.org/10.1007/s10098-021-02180-2